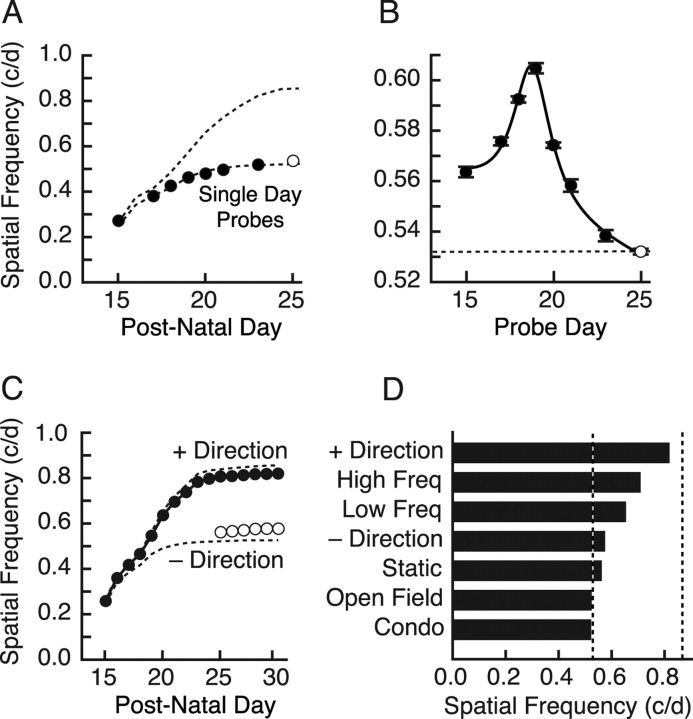
Figure 2.
Experiential control of enhancement. A, “Probe” measurement of OKT maturation with testing on individual days from P15 to P23 (filled circles). The open circle is the OKT SF threshold for the animals in Figure 1A first tested on P25. The top dotted line is the average of the enhanced profiles in Figure 1; the bottom dotted line is the trace of P14 lesioned animals from Figure 1C, which is replotted here and on other figure panels as a convenient reference. B, Effect on OKT SF thresholds at P25 as the result of single-day probe testing in A. Fitting the data with a Lorenz peak on a linear background resolved a vertex at 18.8 d (black line). C, Effect on OKT SF threshold of measuring OKT from P15 to P25 in one direction (filled circles). Testing in the other direction started at P25 (open circles). D, Histogram of OKT SF threshold on P25 of P15–P24 experiential control experiments. Only experience in which animals were presented repeatedly with moving gratings that elicited tracking generated maximal enhancement. The + and − directions are replotted from C. See Results for description of High Freq, Low Freq, Static, Open Field, and Condo. Dashed lines are the average adult SF thresholds for the P15→ (right) and P25→ (left) groups, which are replotted on other figure panels as a convenient reference.

