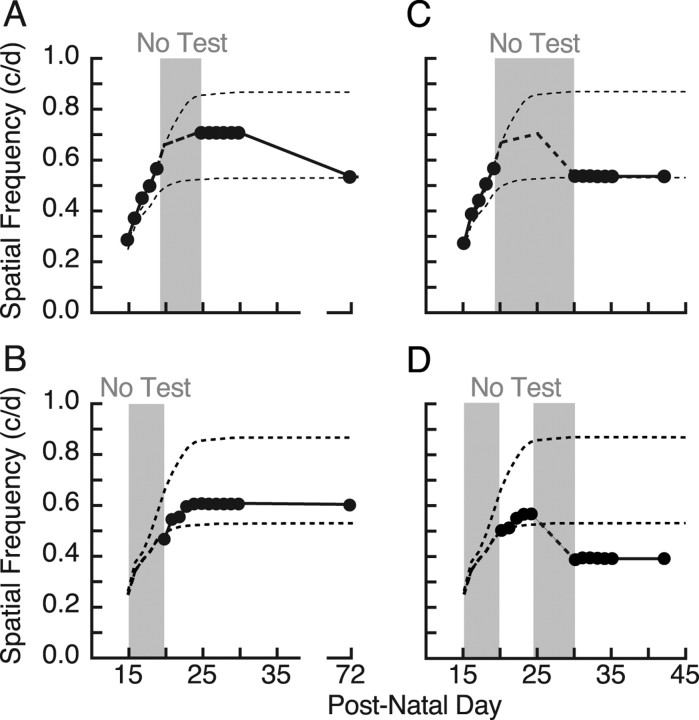
Figure 6.
Interaction between induction and consolidation before P25. A, B, OKT testing experience from P15 to P19 (A) resulted in an enhancement that was evident at P25–P30, but that subsequently decayed (P72 is plotted). When testing commenced at P20 and continued uninterrupted until P30 (B), the resulting enhancement was smaller, but it endured. These data show that the decay in A was not attributable to a failure to reach maximum, and that the requirement for testing to consolidate enhancement starts between P20 and P25. C, Testing from P15 to P19 with a break in testing until P30 revealed no enhancement at P72, showing that testing from P20 to P25 in A was temporarily preventing decay (Fig. 4). The dashed line is the “expected” profile from A. D, Testing experience from P20 to P24 produced a small enhancement (as in B), but a subsequent 5 d interruption in testing resulted in a decrease to below the baseline of naive animals.

