Figure 3.
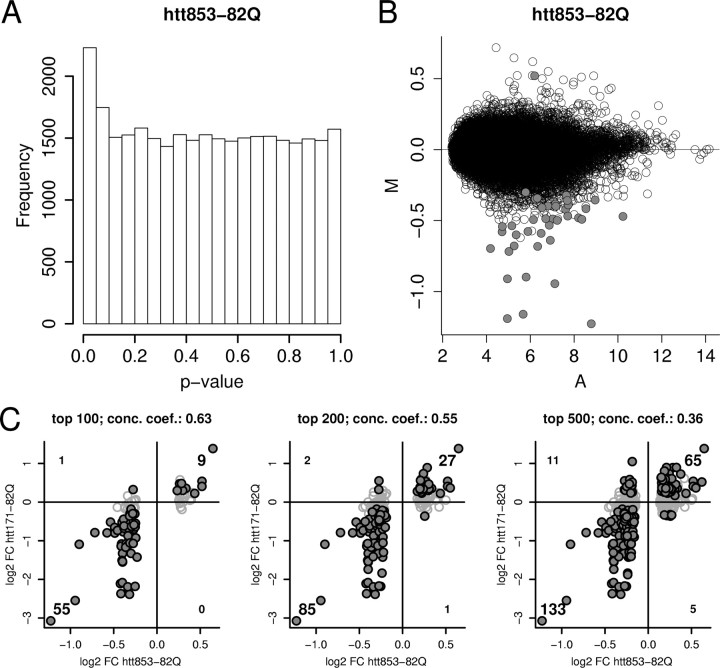
Comparison of overall differential expression signal in htt853-82Q- versus htt853-18Q-expressing cells (n = 6 arrays for each condition) and concordance between htt853-82Q and htt171-82Q model data. A, The distribution of uncorrected p values (compare with Fig. 1). B, The signal (A) and differential expression (M) distributions, with probe sets meeting FDR p < 0.05 (40 probe sets of 31,042 total) indicated by filled circles. Lower stringency cutoffs show 2230 probe sets meet the criterion of nominal p < 0.05, and 473 probe sets meet the criterion of FDR p < 0.33. The top 100, 200, and 500 unique probe sets show a significant transcriptomic relationship to the htt171-82Q model (as shown in C). C, Plots top 100, 200, or 500 differentially regulated genes from the htt853-82Q versus htt853-18Q expression analysis for RNAs detected by both Rat 230A and Rat 230 2.0 arrays. Genes meeting criteria of FDR p < 0.05 in htt171-82Q versus htt171-18Q comparison are indicated by filled black circles. The high fractions of genes showing concordant regulations (top right quadrant for upregulated genes and bottom left for downregulated genes) versus discordantly regulated genes (in top left and bottom right quadrants) represents the strong association between models. Concordance coefficient (conc. coeff.): 0.63 for top 100 genes; 0.55 for top 200 genes; 0.36 for top 500 genes.

