Figure 4.
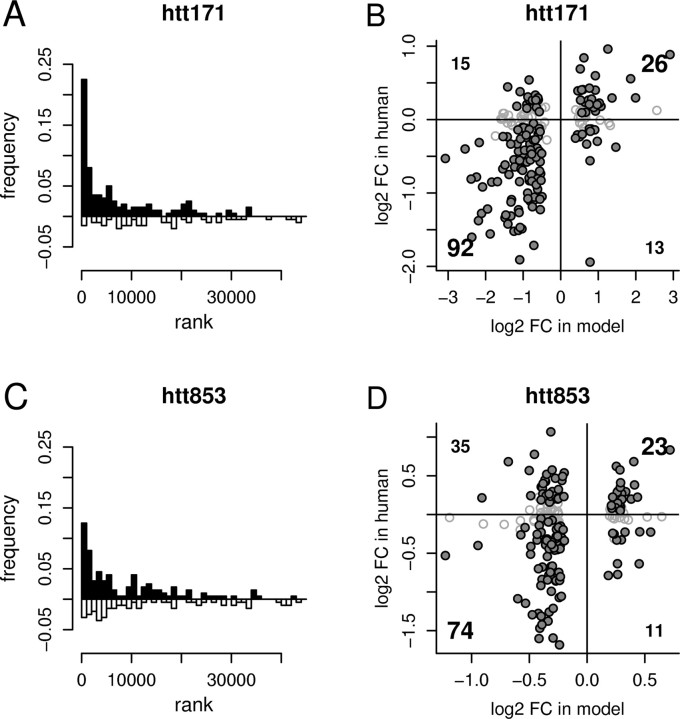
Concordance of HD models with human HD caudate. A, C, The distributions of the top 200 differentially expressed RNAs in htt171-82Q- versus htt171-18Q-expressing cells or htt853-82Q- versus htt853-18Q-expressing cells relative to the differential expression of their orthologs in human HD (see Materials and Methods). Same-sign regulations (increased or decreased in both mouse and human HD) are shown above the x-axis in black; opposite-sign regulations (increased in mouse and decreased in human, or vice versa) are shown below the x-axis in white. B, D, Scatterplots of differential expression in the htt171-82Q model or htt853-82Q model versus human HD. Large numbers in the top right and bottom left quadrants summarize same-sign (concordant) regulations (increased or decreased in both mouse and human HD); small numbers summarize opposite-sign regulations (increased in mouse and decreased in human, or vice versa) in the top left and bottom right quadrants. Filled gray circles indicate RNAs whose human orthologs show statistically significant regulation by the criterion of FDR p < 0.05; open circles (outlined in gray) indicate RNAs for which the orthologous expression measure in human is considered nonsignificant (FDR p ≥ 0.05).

