
Figure 1.
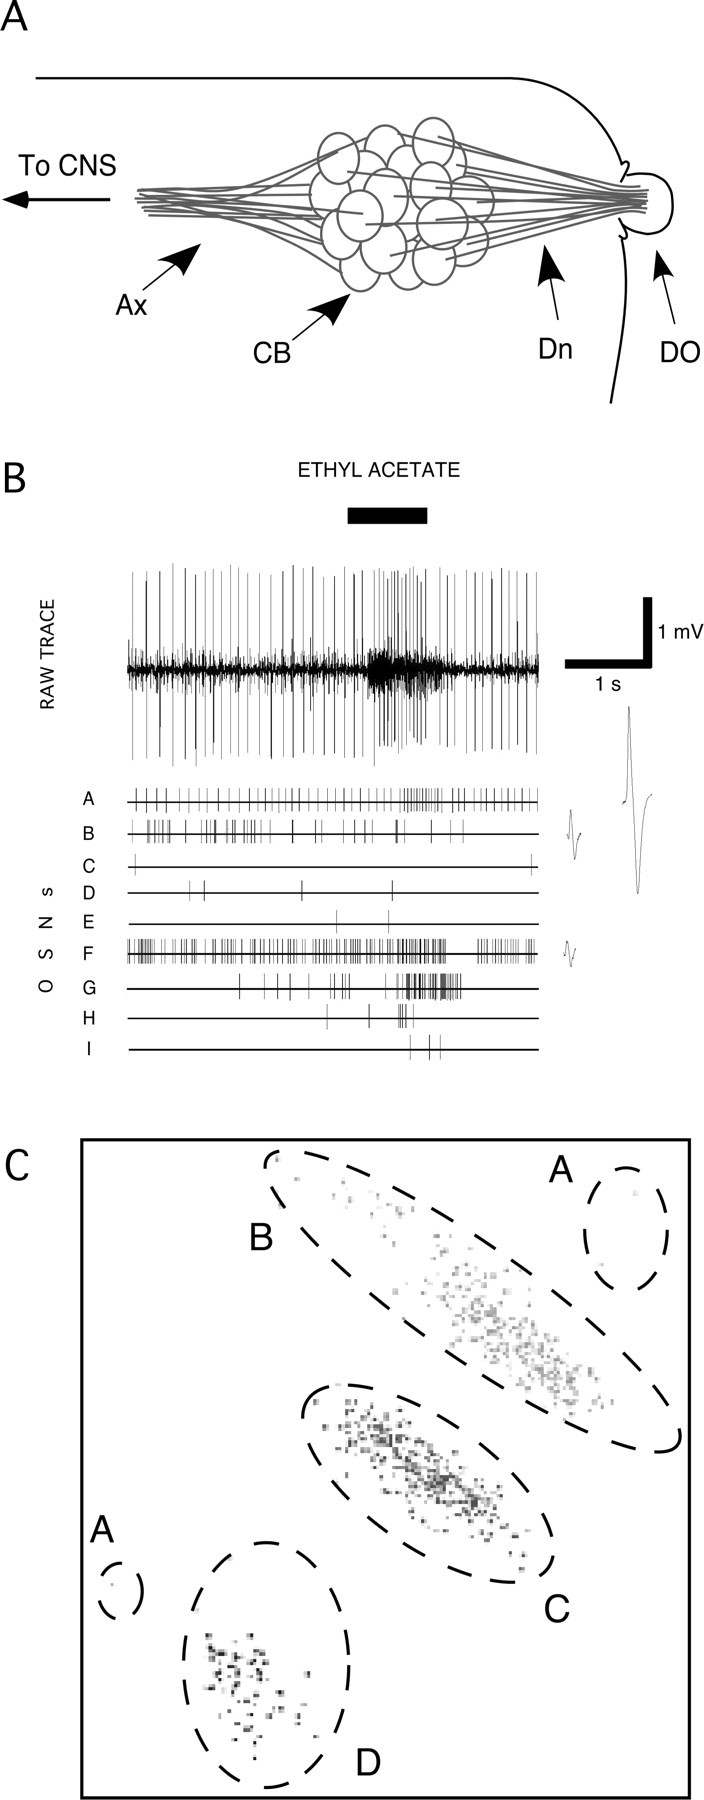
Identifying the differential activity of specific larval OSNs. A, Schematic drawing of the larval peripheral olfactory system. Dn, Dendrites; CB, cell bodies; Ax, axons. The electrode was placed in the larval body around the edge of the DO, and its tip advanced toward the dendrites. B, Typical multiunit recording from a single larva in response to a 1 s stimulation with ethyl acetate. Spike2 software was used to discriminate the activity of nine OSNs in this recording, on the basis of the shape and size of the action potential of each OSN. The lower traces show the firing activity of each OSN, as identified with Spike2. Expanded action potential waveforms are given beside OSNs A, B, and F to illustrate the differences between these neurons. C, Results of Spike2 PCA on signals from a multiunit recording in which the activity of four OSNs were identified. On these two dimensions, four nonoverlapping clouds of data were identified (indicated by different grayscale data points), corresponding to the activity of four OSNs, A–D. Data from unit A are in a single cloud when the data are projected on other principal components. For full details of the recording from which this PCA was taken, see supplemental information, available at www.jneurosci.org as supplemental material.