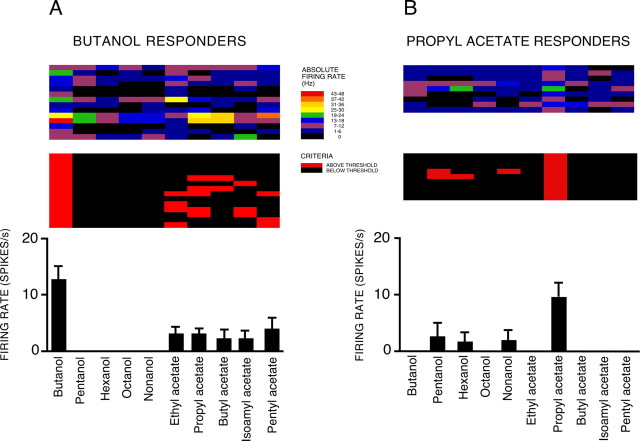
Figure 10.
Specific and variable OSN responses to functional groups. A, B, Responses of OSNs showing specific responses to one odor in each functional group: either butanol (A; n = 14) or propyl acetate (B; n = 9). Data taken from Figure 9. Histograms show mean (±SEM) firing rates above threshold of responding OSNs. Lower heat charts show qualitative response patterns (red, excitation; blue, inhibition; black, no response); top heat charts show absolute firing rates (regardless of spontaneous activity).

