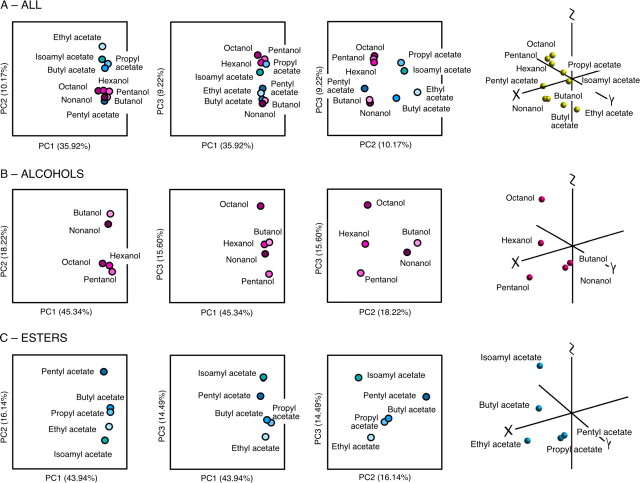
Figure 11.
Principal components analysis of OSN responses. The first three PCs in each analysis of the data from Figure 9 are presented as three pairwise 2D plots and a single 3D plot. A, PCA results for all 10 odors; PC1–3 accounted for 55.32% of the total variability. B, PCA results for alcohols; PC1–3 accounted for 79.1% of the total variability. C, PCA results for esters; PC1–3 accounted for 74.32% of the total variability. For 3D plots, x = PC1; y = PC2; z = PC3. Movies showing the 3D plots in rotation can be found in supplemental information, available at www.jneurosci.org as supplemental material.

