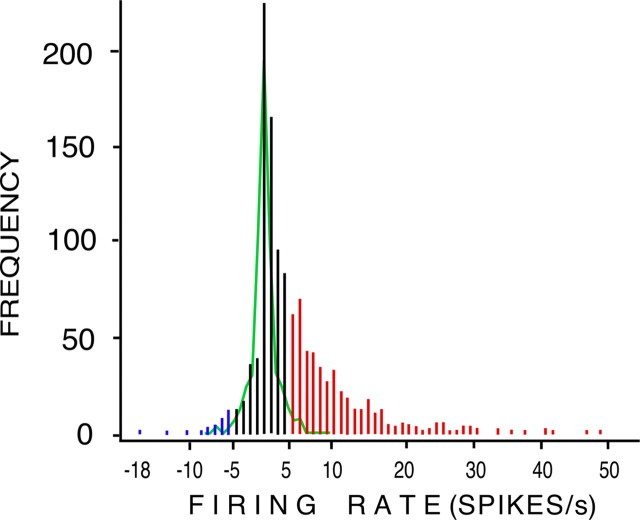
Figure 3.
Distribution of spontaneous OSN activity and of activity during olfactory stimulation. Green line, Frequency curve of 522 second-to-second changes in spontaneous firing rate over a period of 10 s in 58 OSNs from control w1118 larvae. Firing rates were binned into 2 Hz bins. The upper 2.5 percentile of the spontaneous changes was greater than +4 Hz; the lower 2.5 percentile of the spontaneous changes was less than −4 Hz. These cutoffs were used to establish objective criteria for excitation (greater than +4 Hz), inhibition (less than −4 Hz), and no response (−4 − +4 Hz) greater than the largest second-to-second change in spontaneous activity seen in each OSN in the 10 s before stimulation. Histogram, Cumulative frequency graph showing activity induced in 296 OSNs from 50 larvae by 10 stimulus odors, compared with the largest spontaneous change seen in each OSN in the 10 s before each stimulation. Each odor was presented for 1 s, in random order, with a 2 min interstimulus interval. Red, Activity above the excitation threshold; blue, activity below the inhibition threshold; black, activity defined as no response.

