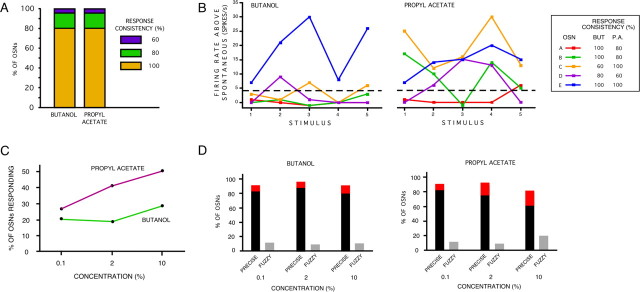
Figure 6.
Fuzzy coding is a property of OSNs. A, Overall percentage of OSNs showing each of the three response consistency values (100, 80, or 60) after stimulation with butanol or propyl acetate. B, Activity of five individual OSNs (identified by color), each from a different larva, in response to five presentations of butanol and propyl acetate. Dotted line, Threshold for classifying activity as a response. Response consistency was calculated by measuring the percentage of consistent responses (excitation or no response) over the five stimulus presentations. This could only have a value of 100 (5 of 5), 80 (4 of 5), or 60 (3 of 5). C, Percentage of OSNs reaching the qualitative response criterion over three concentrations of butanol and propyl acetate. Forty-two OSNs from eight larvae were tested. Each odor concentration was presented twice. The order of presentation was randomized, and there was a 2 min interstimulus interval. D, Percentage of OSNs showing precise (2 of 2) or fuzzy (1 of 2) responses to three concentrations of butanol and propyl acetate, each of which were presented twice. Red bar, Precise responses (2 of 2); black bar, precise nonresponses (2 of 2); gray bar, fuzzy responses (1 of 2).

