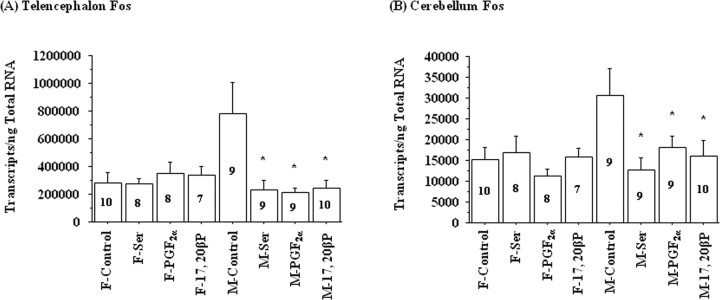
Figure 6.
Exposure to 10−6 m l-serine (Ser), 2 × 10⁻¹⁰ m PGF2α, or 2 × 10⁻¹⁰ m 17,20β-P for 4 h decreased Fos mRNA concentrations in the telencephalon and cerebellum of male (M) but not female (F) goldfish. The number inside each bar represents sample size n for the corresponding group. The asterisk denotes significant difference between control and the treatment group (p < 0.05). Error bars indicate SEM. F, Female; M, male.

