Figure 7.

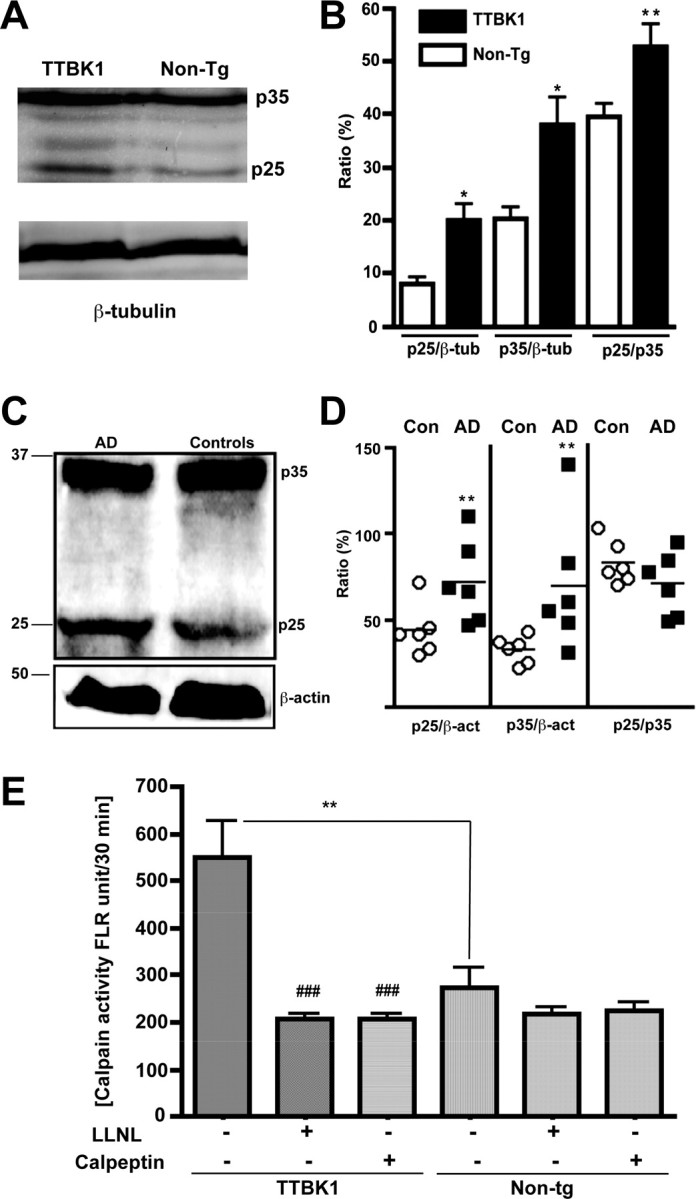
Elevated p25 and p35 subunits of CDK5 complex in TTBK1-Tg mice and AD brain, and calpain I activity in TTKB1-Tg mice. A, C, Immunoblotting of protein extracts from aged mouse cortex (A, 50 μg per lane) or human frontal cortical gray matter (C, 100 μg per lane) using anti-p35 pAb (A, C), anti-β-tubulin mAb (A), or anti-β-actin mAb (C). B, D, Chemiluminescence quantification and ratiometric presentation of p25/β-tubulin, p35/β-tubulin, or p25/p35% ratio (B) or p25/β-actin, p35/β-actin, or p25/p35% ratio (D). *p < 0.05, **p < 0.01 as determined by Student's t test (n = 5 for mouse non-Tg and TTBK1-Tg groups, and n = 6 for human AD and age-matched control groups). E, calpain I activity in the hemibrain of aged TTBK1-Tg and non-Tg mice in the presence or absence of calpain inhibitors (LLNL and calpeptin). **p < 0.01 ###0.001 vs TTBK1-Tg group without inhibitors as determined by ANOVA and Newman–Keuls post hoc.
