Figure 2.

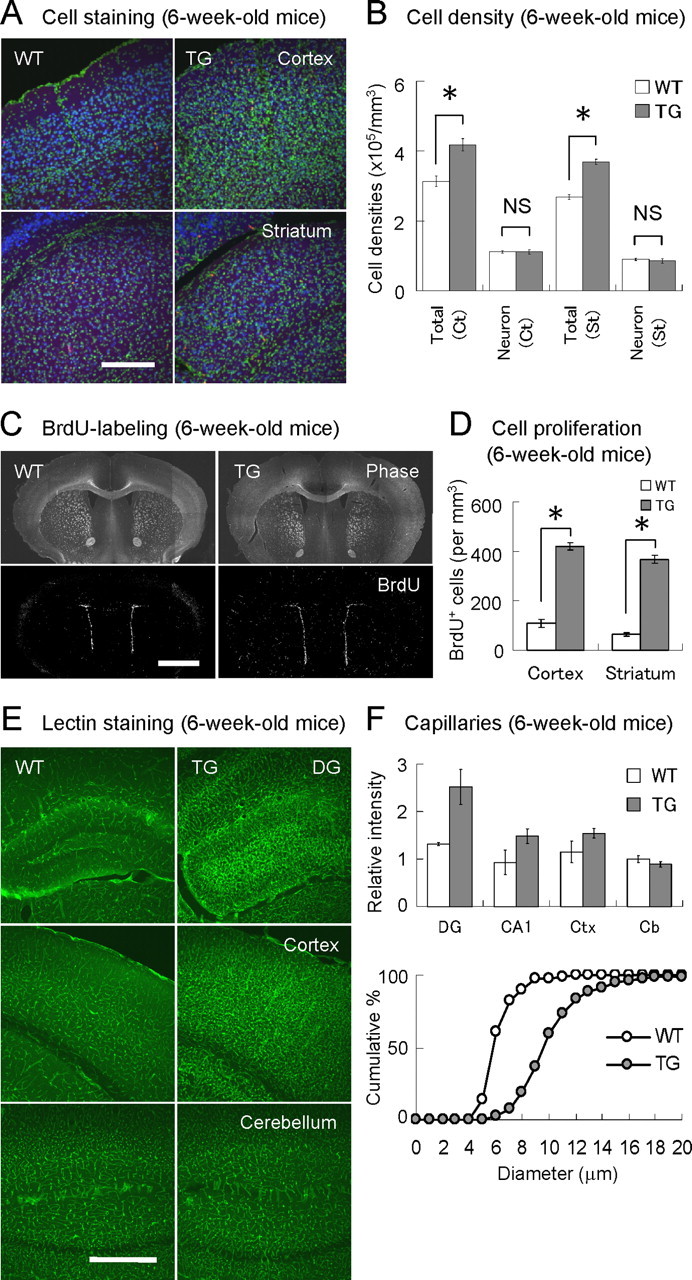
Enhanced cell proliferation and angiogenesis in VEGF120-TG mice. A, Increased cell population in forebrain. Coronal brain sections of 6-week-old WT (left) and TG (right) mice were stained for cell nuclei (green, Syto13 green) and neurons (blue, NeuN as a neuronal marker). Images of cerebral cortex (top) and striatum (bottom) are shown. There are more nuclei in the brain sections of TG mice. B, Cell densities in cerebral cortex and striatum. The total cell density was increased by 30% in TG mice, whereas the neuronal density was similar (although the total neuronal population might be increased because of the enlargement of brain). n = 8 per group, 6-week-old mice; *p < 0.01 and nonsignificant (NS), one-way ANOVA followed by Tukey–Kramer's post hoc test. Data are as follows: total cortical cells: WT mice, 3.13 ± 0.14 × 10⁵ cells/mm3; TG mice, 4.18 ± 0.16 × 10⁵ cells/mm3; cortical neurons: WT mice, 1.12 ± 0.03 × 10⁵ cells/mm3; TG mice, 1.12 ± 0.06 × 10⁵ cells/mm3; total striatal cells: WT mice, 2.81 ± 0.02 × 10⁵ cells/mm3; TG mice, 3.69 ± 0.07 × 10⁵ cells/mm3; striatal neurons: WT mice, 0.90 ± 0.03 × 10⁵ cells/mm3; TG mice, 0.86 ± 0.06 × 10⁵ cells/mm3. C, Distribution of dividing cells in forebrain. Proliferating cells in 6-week-old WT (left) and TG (right) mice were labeled with BrdU for 2 h. Coronal brain sections at cortex/striatum positions were presented as phase-contrast images (top) and BrdU immunofluorescent images (bottom; white dots represent BrdU-positive cells). D, Density of proliferating cells in cerebral cortex and striatum. The graph indicates the densities of BrdU-positive cells in cerebral cortex and striatum. n = 3 per group, 6-week-old mice. *p < 0.01, one-way ANOVA followed by Tukey–Kramer's post hoc test. Data are as follows: cortical BrdU-positive cells: WT mice, 109 ± 16 cells/mm3; TG mice, 420 ± 15 cells/mm3; striatal BrdU-positive cells: WT mice, 65 ± 7 cells/mm3; TG mice, 368 ± 16 cells/mm3. E, Enhanced angiogenesis. Blood vessels were visualized by staining with L. esculentum (tomato) lectin. Representative images of dentate gyrus (DG; top), cerebral cortex (middle), and cerebellum (bottom) in 6-week-old WT (left) and TG (right) mice are shown. F, Quantitative analysis of blood vessels. The bar graph (top) indicates the relative fluorescent intensities of the lectin staining in dentate gyrus (DG), CA1 region (CA1), cerebral cortex (Ctx), and cerebellum (Cb). The values were normalized to the signal intensity in cerebellum of WT mice (set to 1). n = 2–3 per group, 6-week-old mice; p < 0.01 for dentate gyrus and nonsignificant for cerebellum in TG mice, one-way factorial ANOVA followed by Tukey–Kramer's post hoc test. Data for normalized lectin intensities are as follows: dentate gyrus: WT mice, 1.31 ± 0.02; TG mice, 2.52 ± 0.22; CA1: WT mice, 0.93 ± 0.18; TG mice, 1.48 ± 0.19; cerebral cortex: WT mice, 1.15 ± 0.16; TG mice, 1.54 ± 0.19; cerebellum: WT mice, 1.00 ± 0.05; TG mice, 0.89 ± 0.05. The cumulative plot (bottom) indicates capillary diameters (lengths of the minor axes) in polymorphic regions of dentate gyrus in WT (open circle) and TG (filled circle) mice. n = 200 capillaries from 3 mice per group, 6-week-old mice. p < 0.0001, unpaired Student's t test. Data are as follows: capillary diameters: WT mice, 6.1 ± 0.1 μm; TG mice, 10.2 ± 0.2 μm. Scale bars: A, 200 μm; C, 2 mm; E, 500 μm.
