Figure 4.

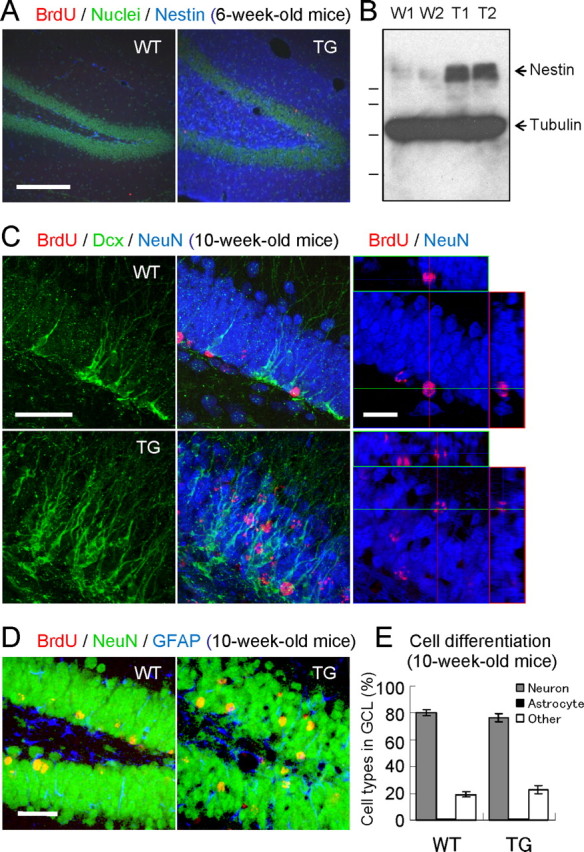
Enhanced hippocampal neurogenesis in VEGF120-TG mice. A, Nestin staining. Immunofluorescent images of Nestin (blue) and nuclei (green) in WT (left) and TG (right) mice showed intense signals of NPCs and/or immature neurons in TG mice. B, Increased expression of Nestin. Western blot analysis of hippocampal extracts showed increased protein expression of Nestin (140 kDa) in TG mice (two mice per genotype: W1 and W2 for WT mice; T1 and T2 for TG mice; 6-week-old mice). β-Tubulin was used as an internal control (51 kDa). Molecular weight standards are 103, 77, 50, and 34 kDa. C, Dcx staining. Mice were labeled with BrdU at 6 weeks of age and examined at 10 weeks of age. Brain sections were triple stained to identify immature neurons (green, Dcx), neurons (blue, NeuN), and 4-week-survived young cells (red, BrdU). The left four panels represent Dcx staining, and merged images of GCL in WT (top panels) and TG (bottom panels) mice. See also Dcx-stained images in supplemental Figure 2 (available at www.jneurosci.org as supplemental material). The right panels represent orthographic images of BrdU/NeuN-double positive cells in WT (top) and TG (bottom) mice. See also enlarged images in supplemental Figure 3 (available at www.jneurosci.org as supplemental material). In WT mice, most of the immature neurons were localized in the innermost layer of GCL. In contrast, many immature neurons are scattered within GCL in TG mice. Dendritic arbor of immature neurons appeared to be more developed in TG mice. Similarly, 4-week-survived BrdU-labeled cells (many of them differentiated into neurons) were found in the inner layer of GCL in WT mice, but they were also found in the middle or even outer layer of GCL in TG mice. D, Differentiation of newborn cells in GCL. Dividing cells in 6-week-old mice were labeled with BrdU, and they were allowed to differentiate for 4 weeks. Brain slices were triple stained for BrdU (red, 4-week-old young cells), NeuN (green, neurons), and GFAP (blue, astrocytes). The images show a region of dentate gyrus in WT (left) and TG (right) mice. E, Quantification of cell types. The graph indicates the percentages of BrdU-labeled neurons, astrocytes, and other cells in GCL. Most of the newborn cells had differentiated into neurons (80%). There was no difference between genotypes. n = 16 slices from 4 mice per group, 10-week-old mice. Nonsignificant for neurons, astrocytes, or other cell types between WT and TG mice by the Steel-Dwass's test. Data are as follows: neurons: WT mice, 80.2 ± 2.3%; TG mice, 76.5 ± 2.9%; astrocytes: WT mice, 0.6 ± 0.5%; TG mice, 0.5 ± 0.3%; other cell types: WT mice, 19.2 ± 2.1%; TG mice, 23.0 ± 3.0%. Scale bars: A, 200 μm; C, 50 μm (left), 25 μm (right); D, 50 μm.
