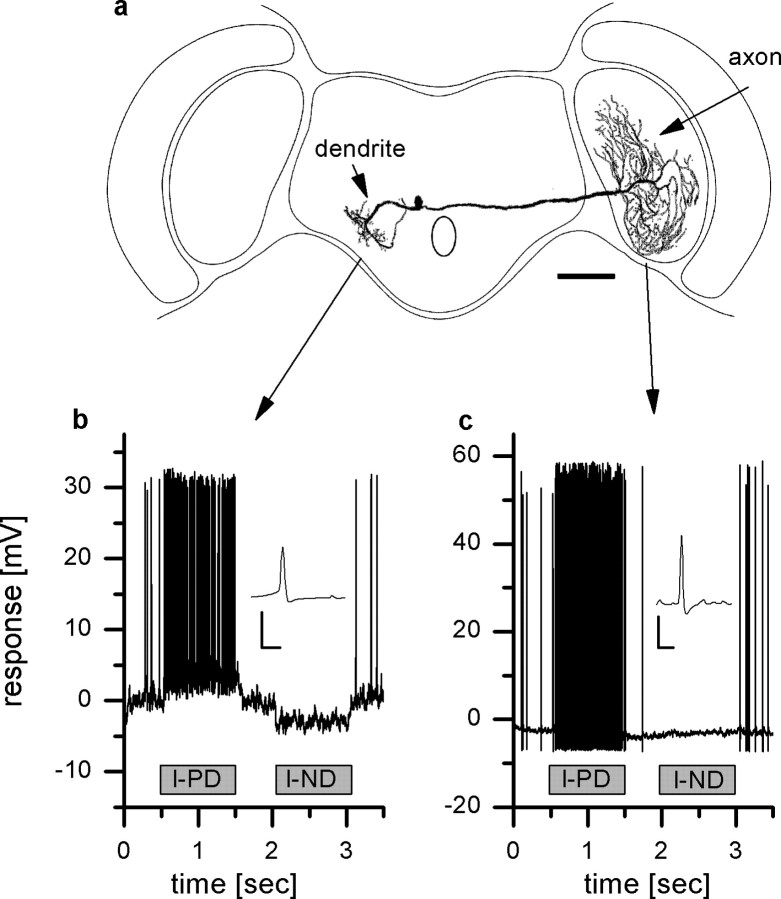
Figure 1.
Intracellular recording from V1. a, Reconstruction of the cell and recording sites. Scale bar, 200 μm. b, Example response of V1 to vertical motion recorded in the dendrite. The cell responds to downward motion (l-PD) with an increase, to upward motion (l-ND) in front of the left eye with a decrease in spike frequency. In addition, a graded shift in membrane potential can be measured. The inset shows an averaged action potential. Calibration: 5 mV, 0.5 ms. c, Responses of V1 to vertical motion measured in the axon terminal. In contrast to the dendritic recording, no graded membrane potential change can be observed. The inset shows an averaged action potential. Calibration: 5 mV, 0.5 ms. Data in b and c are from two different flies.

