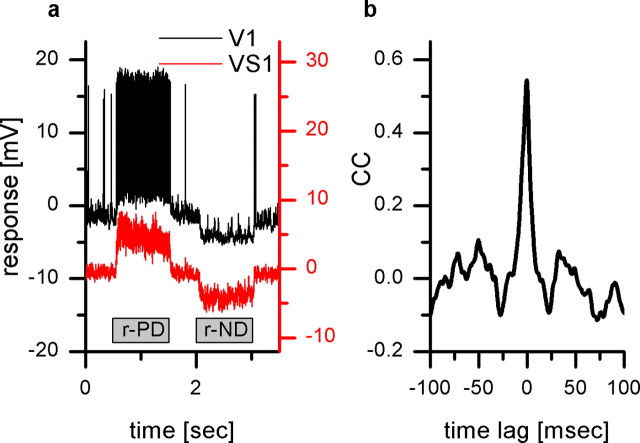
Figure 2.
Double intracellular recording from VS1 and V1. a, Time course of the response to motion stimuli of V1 (black) and a simultaneously recorded VS1 (red). Both cells respond to up (r-ND) and downward (r-PD) motion in front of the right eye in a similar manner: they respond with a depolarization to a pattern moving in the preferred direction and a hyperpolarization to a pattern moving in the null direction. In addition, in V1, full-blown action potentials can be recorded. b, Normalized cross correlogram (see Materials and Methods) of the signals shown in a. The cross correlograms were calculated for 0.8 s of the responses of the cells to null direction motion (time interval, 5.1–5.9 s; a). The peak of the cross correlogram occurs at 0.6 ms time lag (SD ± 0.16 ms) between the signal of VS1 and V1. CC, Cross correlation.

