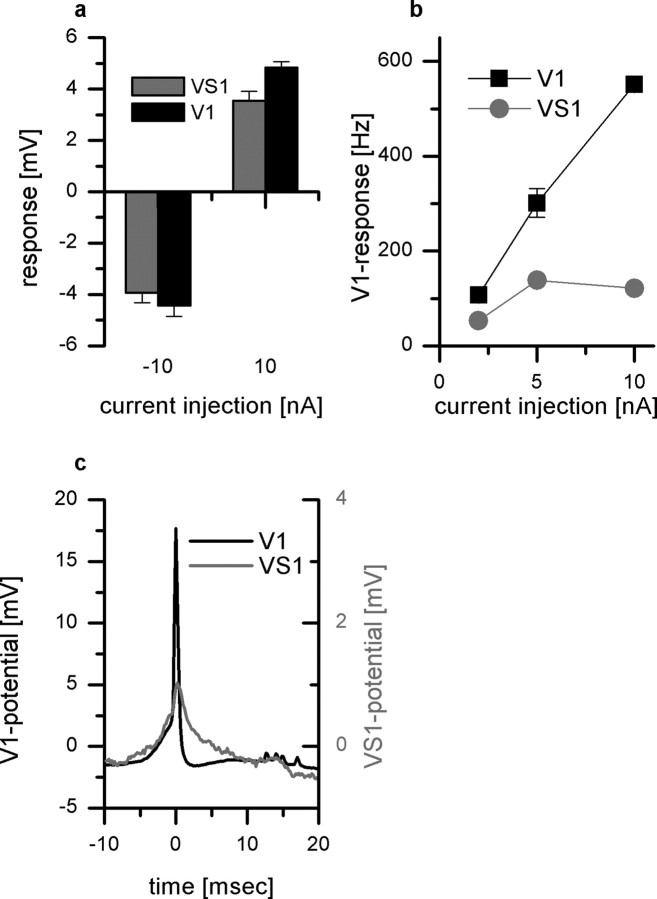
Figure 3.
Current injection into VS1 and V1. a, Current injection of −10 nA and +10 nA in V1 led to a hyper and depolarization of VS1 (gray bars), respectively. Current injection into VS1 elicited a hyper and depolarization in V1 (black bars). This bidirectional and bipolar coupling speaks in favor of electrical synapses. Data represent the mean ± SEM of three sweeps. b, Current injection altered the spike frequency of V1. Direct current injection of +10 nA into V1 resulted in a maximum firing frequency of 550 Hz. Depolarizing current injection in VS1 changed the firing frequency of V1 to a lesser extent. c, Spike-triggered average of the VS1 membrane potential. The black line shows the average spike in V1 which served as a trigger for averaging the membrane potential of VS1 (gray line). The peak of the VS1 cell signal is delayed by 0.2 ms (SD ± 0.16 ms) compared with the peak of the V1 cell signal.

