
Figure 4.
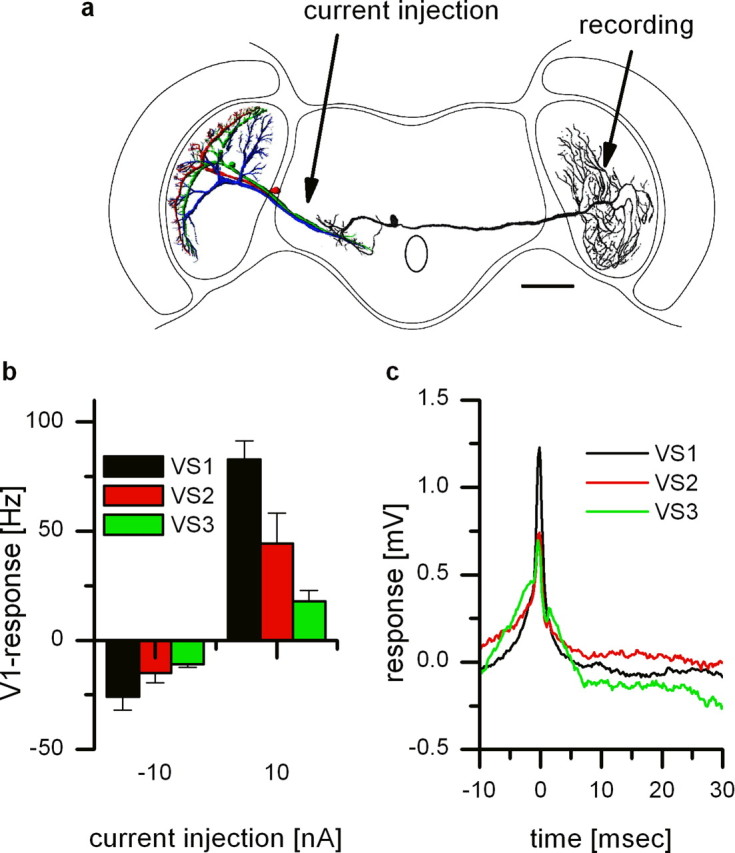
Extracellular recording from V1 and intracellular recording of different VS cells. a, Reconstruction of the cells and recording sites. Intracellular recordings were done from VS cells of the left brain hemisphere, whereas V1 was recorded in the right brain hemisphere. Note that the reconstructions of the VS cells and the V1 cell are from different flies. Scale bar, 200 μm. b, Current injection of −10 nA and +10 nA in different VS cells elicited different levels of spike frequency in V1. V1 responded with a decrease and increase when current was injected into VS1–VS3. The strongest response was found for current injection into VS1. Data represent the mean ± SEM of VS1 (n = 7), VS2 (n = 5), VS3 (n = 3). c, Spike-triggered average of the membrane potential of VS1–VS3. Extracellularly recorded spikes in V1 served as a trigger for averaging the membrane potential of the VS cells. As expected from the current injection experiments, VS1 (black line) showed the strongest peak and VS3 (green line) the weakest peak. The delay between V1 spikes and EPSPs in VS cells turned out to be 0.2 ms (SD ± 0.2 ms) for all VS cells. Note that the average waveform for all three VS cells looks quite similar.