
Figure 6.
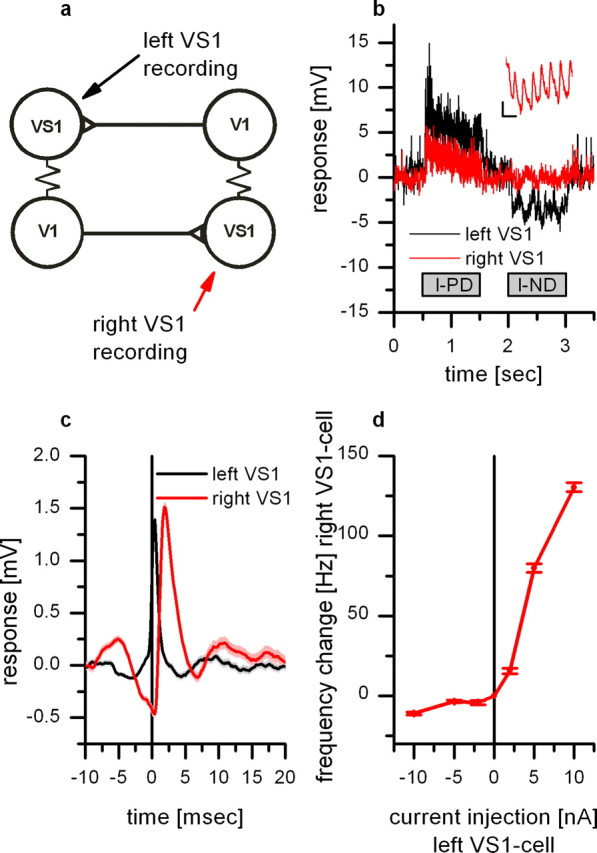
Double intracellular recording from a VS1 located in the right brain hemisphere and a VS1 from the left hemisphere. a, Schematic diagram illustrating the wiring scheme between VS1 cells and V1 cells. b, Time course of the response to motion stimuli of a VS1 located in the left brain hemisphere (black) and a simultaneously recorded VS1 from the right brain hemisphere (red). The motion stimulus was presented in front of the left eye. Although the left VS1 responds with a graded depolarization and hyperpolarization to preferred and null direction motion, respectively, the right VS1 did not respond to null direction motion. The response to preferred direction consisted mainly on EPSPs. The inset shows the response of the right VS1 cell during downward motion with a higher temporal resolution. Calibration: 1 mV, 10 ms. c, EPSP-triggered average of the right VS1 membrane potential. The black line shows the average EPSP in the left VS1 which served as a trigger for averaging the membrane potential of the right VS1 (red line). The EPSP found in the right VS1 reflects the spike input from the left V1. The signal in the right VS1 is delayed by 1.6 ms. Data show the mean ± SEM of 288 events recorded in five sweeps. d, Current injection in the left VS1 leads to an increase in EPSP frequency in the right VS1. Data show the mean ± SEM of five sweeps per stimulus condition.