
Figure 7.
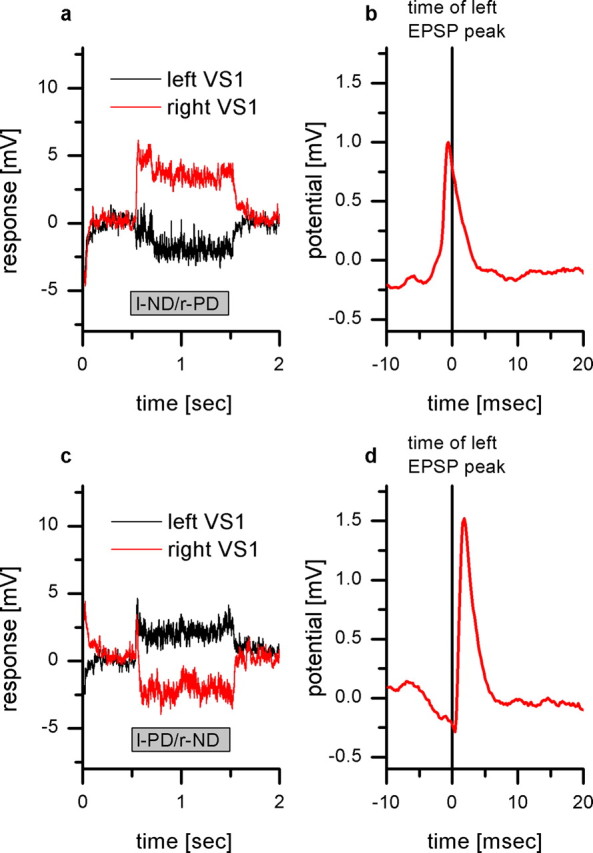
Responses of a right VS1 and a left VS1 to binocular motion stimuli. a, Response of the left VS1 (black line) and the right VS1 (red line) to preferred direction motion in front of the right eye and null direction motion in front of the left eye. This binocular stimulus leads to a hyperpolarization of the left VS1 and a depolarization of the right VS1. Data show the mean response averaged over five sweeps. b, EPSP-triggered average of the right VS1 membrane potential. As in Figure 6c, the detected EPSPs in the left VS1 were used as a trigger to average the membrane potential of the right VS1. The resulting peak occurs 0.6 ms before the peak of the right VS1 cells, representing the spikelet caused by the electrical coupling to the right V1 cell. Data show the mean of 305 events recorded in five sweeps. c, Response of the left VS1 (black line) and the right VS1 (red line) to preferred direction motion in front of the left eye and null direction motion in front of the right eye. This binocular stimulus leads to a depolarization of the left VS1 and a hyperpolarization of the right VS1. Data show the mean response averaged over five sweeps. d, EPSP-triggered average of the right VS1 membrane potential. Again, the detected EPSPs in the left VS1 were used as a trigger to average the membrane potential of the right VS1. The resulting peak occurs 1.8 ms after the peak of the right VS1 cells. The peak represents the input from the left V1 cell onto the right VS1. Data show the mean of 171 events recorded in five sweeps.