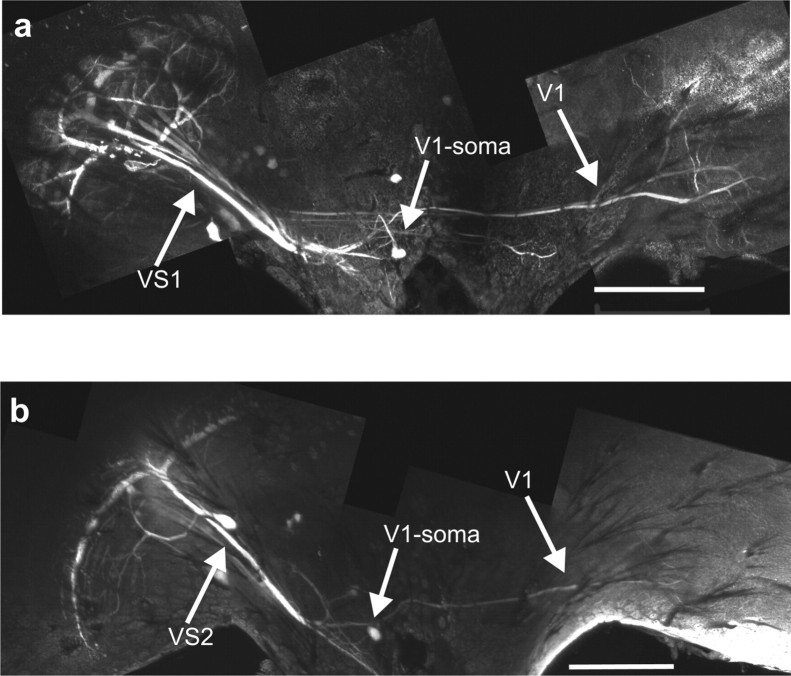
Figure 8.
Dye coupling between VS1 and V1. a, Neurobiotin staining of a VS1. In addition to the costaining of adjacent VS cells, V1 was found to be labeled, too. This confirms the results about the electrical coupling between VS1 and the V1 (Fig. 2). The dye coupling between VS1 and V1 was found in a total of three different flies. b, Neurobiotin staining of a VS2 cell. If Neurobiotin was injected into VS2 or VS3, we found a costaining of V1, too. The images show x–y maximum intensity projections of the z-stacks. Scale bars, 200 mm.

