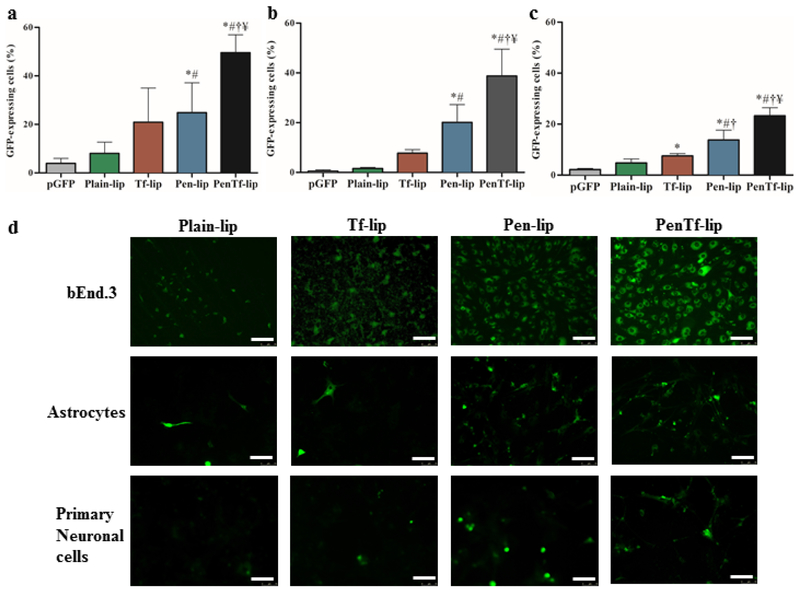
Fig. 9.
GFP expression levels 48 h after transfection in (a) bEnd.3 cells, (b) astrocytes and (c) primary neuronal cells treated with Plain-, Tf-, Pen- and PenTf-liposomes containing pGFP (1μg). Data expressed as mean ± SD (n=4). Statistically significant (p<0.05) differences are shown as (*) with pGFP, (#) with Plain-lip, (†****) with Tf-lip and (¥) with Pen-lip. (d) Fluorescence microscopy images of GFP expression in bEnd.3, astrocytes and primary neuronal cells treated with Plain-, Tf-, Pen- and PenTf-liposomes containing pGFP (Scale bar: 100 μm).

