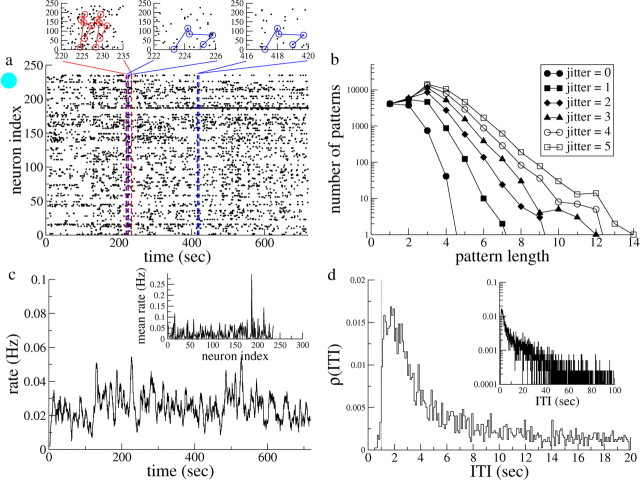
Figure 1.
Example of one experimental dataset. a, Raster plot in which each dot represents a transition from a down state to an up state in a cortical cell. Color-coded insets, Blowups of the raster plot in which repeated patterns are indicated. The six-cell pattern (in red) repeats after a few seconds, whereas the five-cell pattern (in blue) does so after several hundred seconds. b, The number of occurrences of repeating patterns as a function of pattern length. Shown are distributions for jitters of between 0 and 5 (see symbols in legend). c, The time-varying rate of transitions, calculated with a running average of 500 ms (5 bins). Inset, Mean transition rate for each neuron. d, The ITI distribution for all cells. An offset of ∼1 s (10 bins) is indicated by the dashed line. Inset, The same distribution on a log-lin scale.

