
Figure 2.
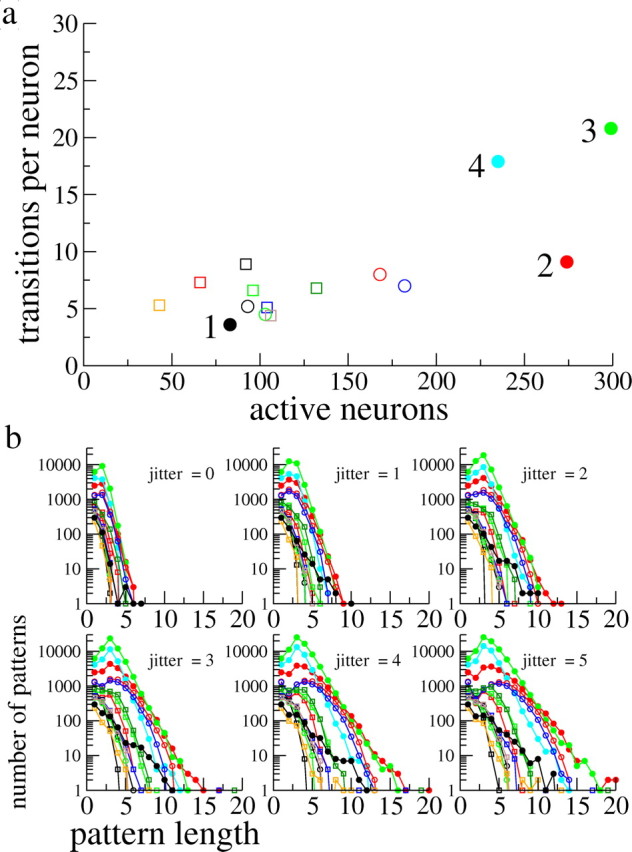
Data from all experimental datasets. a, A scatter plot showing the number of transitions per neuron versus the total number of active neurons. Each dataset is represented by a different symbol. The datasets given by the solid circles are those for which pairwise interactions are needed to reproduce the distributions of repeating patterns. They are also numbered 1–4 for ease of reference in the text. Note that the dataset from Figure 1 is given by the solid blue circle (dataset 4). b, The pattern distributions as in Figure 1b for all datasets and for different jitters. The symbols correspond to the datasets shown in a.