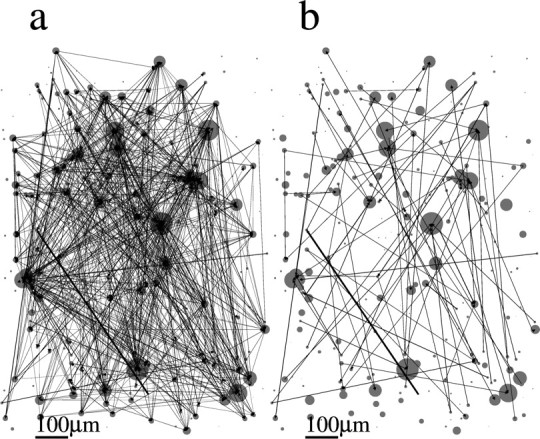
Figure 7.

Spatial organization of networks of dataset 2. The spatial position of each neuron in the slice is represented by a circle. The diameter of the circle is proportional to the rate of transitions from the down to the up state in the corresponding neuron. Arrows indicate a nonzero pij as estimated from the model. The thickness of the arrow is proportional to the value of pij. Scale bar, 100 μm. a, Full topology. b, Only connections with pij > 0.2.
