Figure 1.
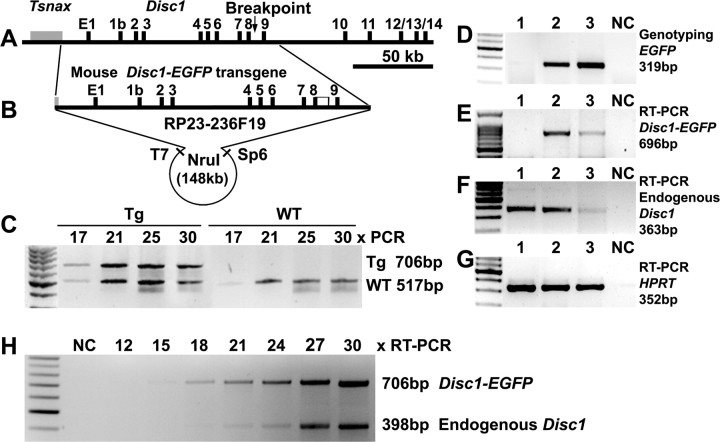
The truncated mouse Disc1 transgene and expression. A, Genomic organization of the mouse Disc1 locus, with an arrow corresponding to the breakpoint in the Scottish family. B, A BAC clone RP23–236F19 containing ∼148 kb mouse Disc1 genomic DNA, starting from the 3′UTR of Tsnax, and ending with 16.7 kb of Disc1 intron 9. The BAC was fused to an EGFP at the end of exon 8 followed by a PolyA. The NruI fragment (148,730 bp) was purified for microinjection. C, M19 heterozygous transgenics contained 2 copies of the transgene, as similar intensity of PCR products were obtained from the truncated and endogenous Disc1 genes at 17–30 cycles. D, Two E17.5 embryos (lanes 1–2) and a transgenic mother (lane 3) were genotyped by PCR with EGFP primers. E–G, RT-PCR with primers for the transgene (E), the endogenous Disc1 (F), and a housekeeping HPRT (G), showing comparable levels of the truncated (E) and full-length (F) Disc1 mRNA. H, Relative expression of endogenous Disc1 and Disc1tr-EGFP demonstrated by RT-PCR at 12, 15, 18, 21, 24, 27, and 30 cycles. The average ratio of the RT-PCR products 706 bp:398 bp at 18–30 cycles was 1.09 ± 0.19, showing comparable abundance of endogenous and truncated Disc1 mRNA (Fig. 1H). NC, Negative control.

