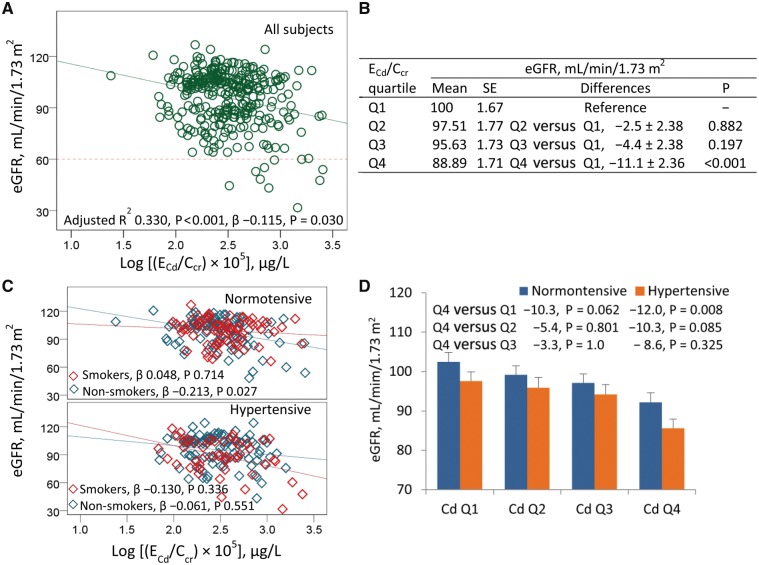
FIGURE 1.
E Cd rate as a predictor of eGFR decline. The eGFR versus log [(ECd/Ccr)×105] scatterplots compare eGFR to ECd rate in all subjects (A), and in normotensive and hypertensive subjects who smoked and did not smoke (C). The reference line in (A) is based on the CKD diagnosis, eGFR <60 mL/min/1.73 m2. (B) The mean eGFR±SE values for subjects in each quartile (Q) of ECd. (D) The bars represent mean eGFR±SE values in normotensive and hypertensive subjects in each quartile of urinary Cd. The numbers above the bars are mean differences of eGFR in urinary Cd quartile 4, compared with quartiles 1, 2 and 3. All mean eGFR values are adjusted for covariates (age at 47.2 years and BMI at 24.47 kg/m2) and interactions. The ECd/Ccr×100 (SD) values in urinary Cd quartiles 1, 2, 3 and 4 are 1.37 (0.35), 2.42 (0.31), 3.90 (0.61) and 9.22 (4.81) μg/L of filtrate, and the corresponding numbers of subjects are 77, 76, 77 and 79, respectively.

