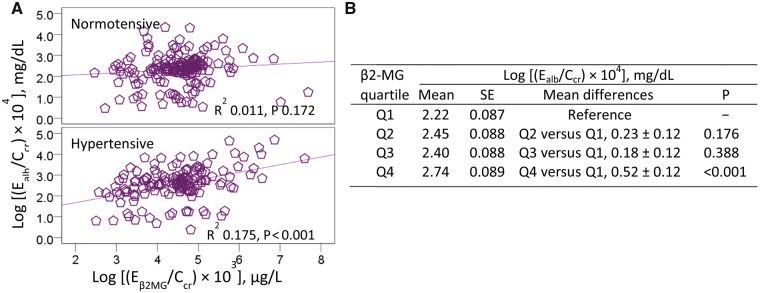
FIGURE 2.
Urinary β2-MG as a predictor of an increase in albumin excretion. (A) The scatterplots of log [(Ealb/Ccr) × 104] versus log [Eβ2MG/Ccr) × 103] compare albumin excretion to β2-MG excretion in normotensive and hypertensive subjects. (B) The mean [(Ealb/Ccr) × 104]±SE values for subjects in each quartile of urinary β2-MG excretion. The mean (SD) values for urinary β2-MG excretion as Eβ2MG/Ccr × 100 in urinary β2-MG quartiles (Q) 1, 2, 3 and 4 are 3.52 (2.48), 22.39 (8.47), 56.89 (13) and 1940 (7217) µg/L of filtrate, and the corresponding numbers of subjects are 76, 78, 77 and 76, respectively.

