
Figure 1.
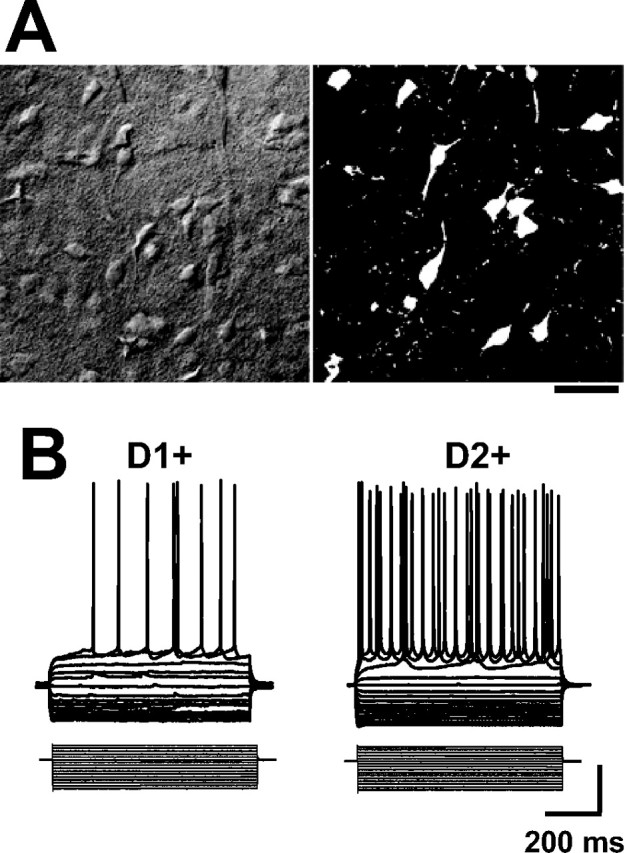
Characteristics of D1+ and D2+ medium spiny neurons. A, Examples of differential interference contrast (left) and fluorescence (right) confocal micrographs of a corticostriatal slice prepared from a BAC D2 EGFP mouse. EGFP expression was used to classify MSNs as D1+ or D2+. Scale bar, 20 μm. B, Examples of current-clamp recordings with K-gluconate internal, demonstrating responses to a series of hyperpolarizing and depolarizing current injections (20 pA steps) from RMPs of −65 mV in a D1+ and D2+ MSN. Calibration: 20 mV, 100 pA.