
Figure 3.
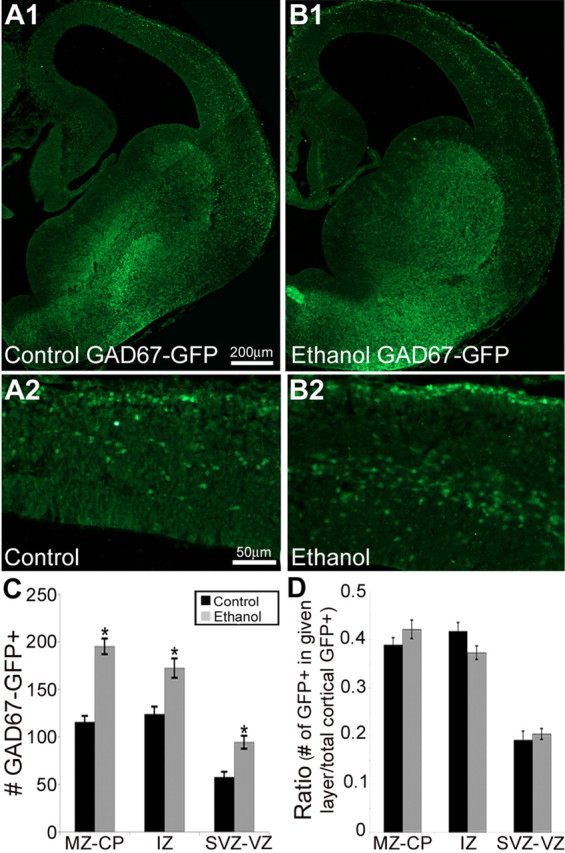
A, B, Representative sections from E14.5 GAD67-GFP knock-in control (A; n = 22) and ethanol-treated (B; n = 18) embryos. A2 and B2 are enlargements of the neocortex in A1 and B1, respectively. C, Exposure to ethanol in utero increased the number of GAD67-GFP cells throughout the cortical layers (Student's t test; MZ–CP, p < 0.001; IZ, p = 0.003; SVZ–VZ, p < 0.001). D, However, the ratio between the cortical layers is unaltered (Student's t test; MZ–CP, p = 0.26; IZ, p = 0.12; SVZ–VZ, p = 0.92). Data are expressed as mean density ± SEM. Asterisks denote a significant difference from control (Student's t test, p < 0.005).