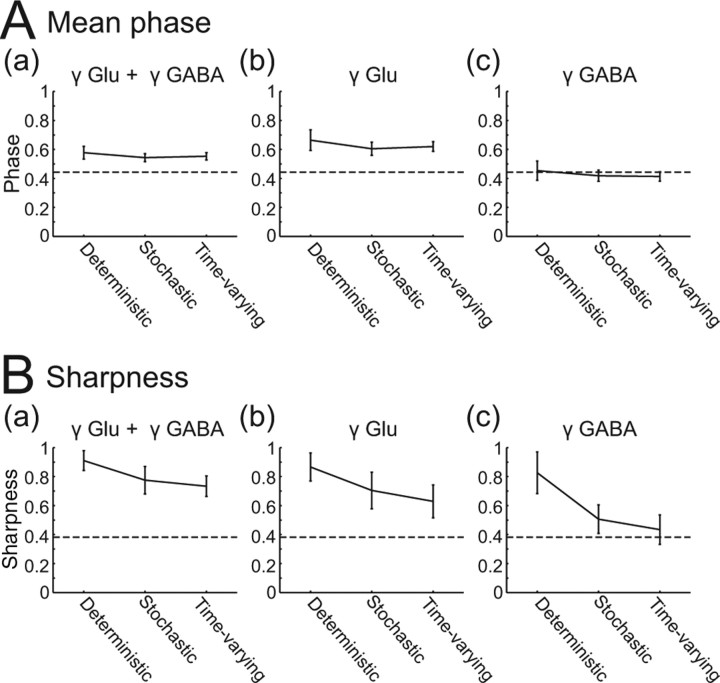
Figure 4.
Quantitative comparison of spike phase distribution shape under different regimens of stimulation. Each panel compares nonstochastic 40 Hz γ stimulation (compare Fig. 2A,B), stochastic γ stimulation (compare Fig. 2C,D), and time-varying γ stochastic stimulation (Fig. 3). Mean (A) and sharpness (B) (see Materials and Methods) of the spike phase distributions of RS cells receiving both γ-modulated excitation and inhibition (a), γ-modulated excitation and stationary inhibition (b), and stationary excitation and γ-modulated inhibition (c). Error bars indicate average ± SD over nine cells. Dashed horizontal lines indicate the mean (A) and the sharpness (B) of the in vivo RS spike phase distribution used as the presynaptic spike density to synthesizing conductances (Fig. 1C).

