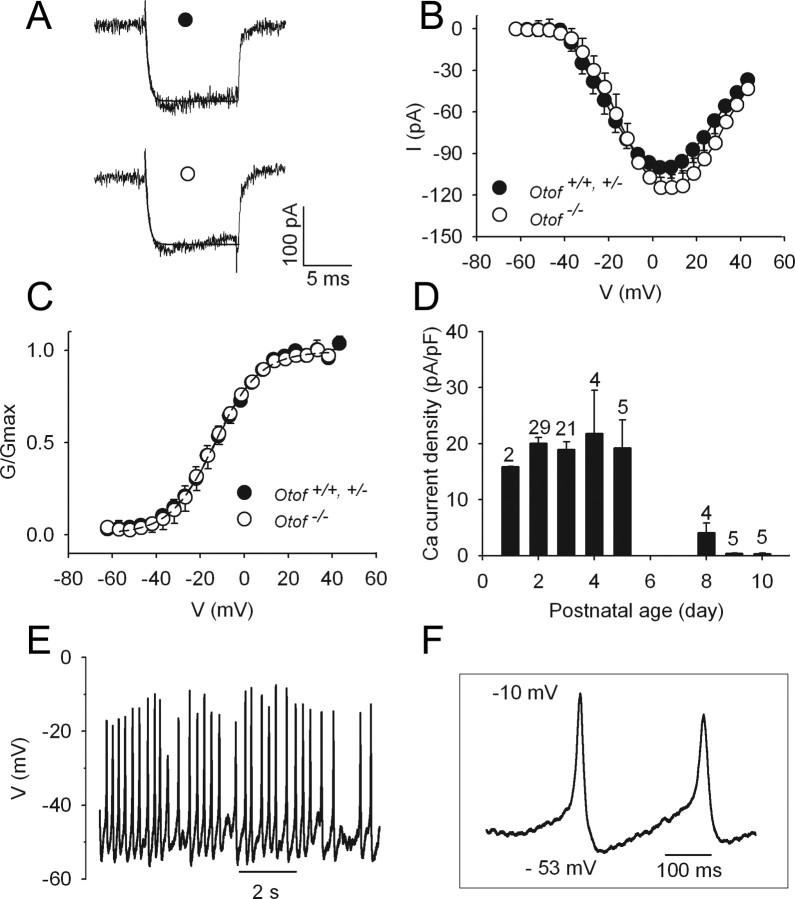
Figure 1.
Properties of calcium currents in immature OHCs from Otof+/+ and Otof−/− mice. A, Examples of ICa recorded in OHCs of Otof+/+ (●) and Otof−/− (○) P2 mice. Currents were evoked by 10 ms voltage steps from a −82 mV holding potential to 0 mV. Single-exponential fits (solid lines) show similar activation kinetics, with τ = 342 μs (●) and 340 μs (○). B, Comparative ICa–V curves in OHCs of Otof+/+ and Otof+/− (●; n = 11) and Otof−/− (○; n = 9) mice. C, Average normalized ICa conductance in Otof+/+, Otof+/−, and Otof−/− mice. Continuous lines are Boltzmann fits with the following parameters: Gmax = 2.6 ± 0.4 and 3 ± 0.2 nS; V1/2 = −12.2 ± 0.5 and −12.3 ± 0.5 mV; and k = 10.1 ± 0.4 and 9.9 ± 0.5 mV for Otof+/+ and Otof+/− and Otof−/− OHCs, respectively. D, Peak calcium current density (expressed in pA/pF) as a function of postnatal age in Otof+/+ and Otof+/− OHCs. The numbers of tested cells are indicated on the histogram. Note the drastic decrease of ICa density after P6. E, Example of a train of spontaneous action potentials recorded from a P3 Otof+/− OHC. The voltage recording was made in the absence of any current injection, in artificial perilymph with 10 mm calcium, at RT. F, Enlarged view of two action potentials.

