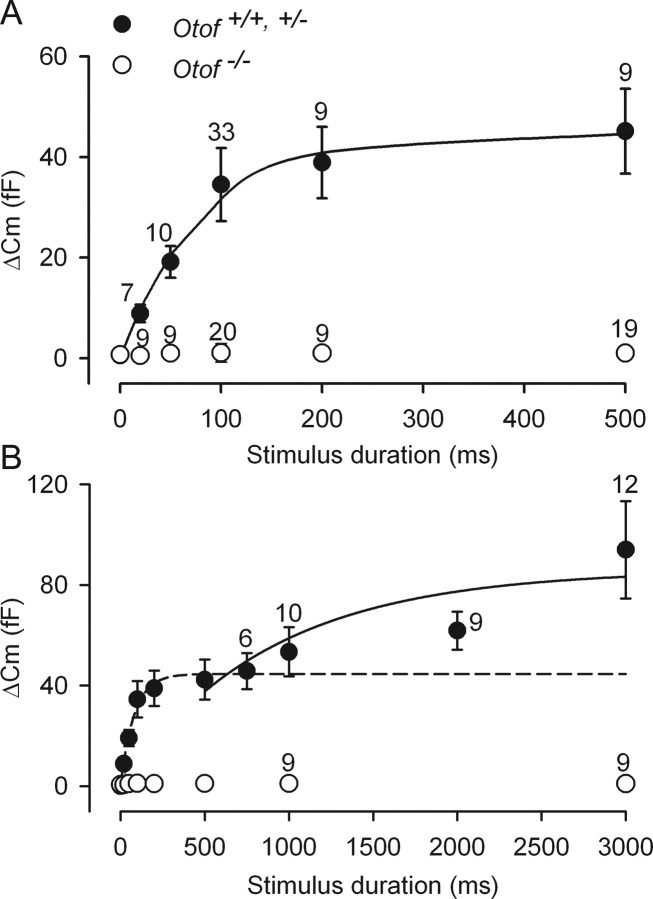
Figure 3.
Kinetics of exocytosis in immature OHCs. A, B, Average ΔCm was plotted as a function of the voltage stimulus duration. All cells were voltage stepped to 0 mV from a holding potential of −82 mV. ΔCm was obtained in response to stimuli with varying durations, up to 500 ms (A) or 3000 ms (B). Solid lines correspond to two consecutive single-exponential fits, with τ = 79.3 ms in A, and τ = 870 ms in B, which define an RRP and an SRP of synaptic vesicles, respectively. In B, the dashed line is extrapolated from the fit shown in A. Numbers of tested P2–P3 OHCs are indicated on the graphs.

