Figure 4.
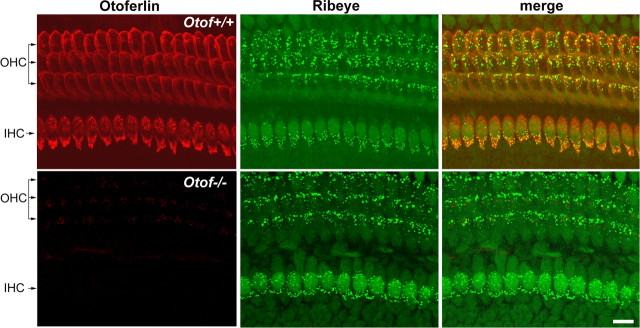
Otoferlin and ribeye distributions in the organ of Corti of P3 Otof+/+ and Otof−/− mice. In the P3 Otof+/+ mouse, otoferlin (red) is detected both in IHCs and OHCs. At this stage, both cell types contain synaptic ribbons, revealed by the ribeye immunolabeling (green). The otoferlin and ribeye stainings largely overlap, as shown in yellow in the merged panel. In the P3 Otof−/− mouse, otoferlin is not detected in hair cells, whereas the ribeye immunolabeling is undistinguishable from that of Otof+/+ mice. Scale bar, 10 μm.

