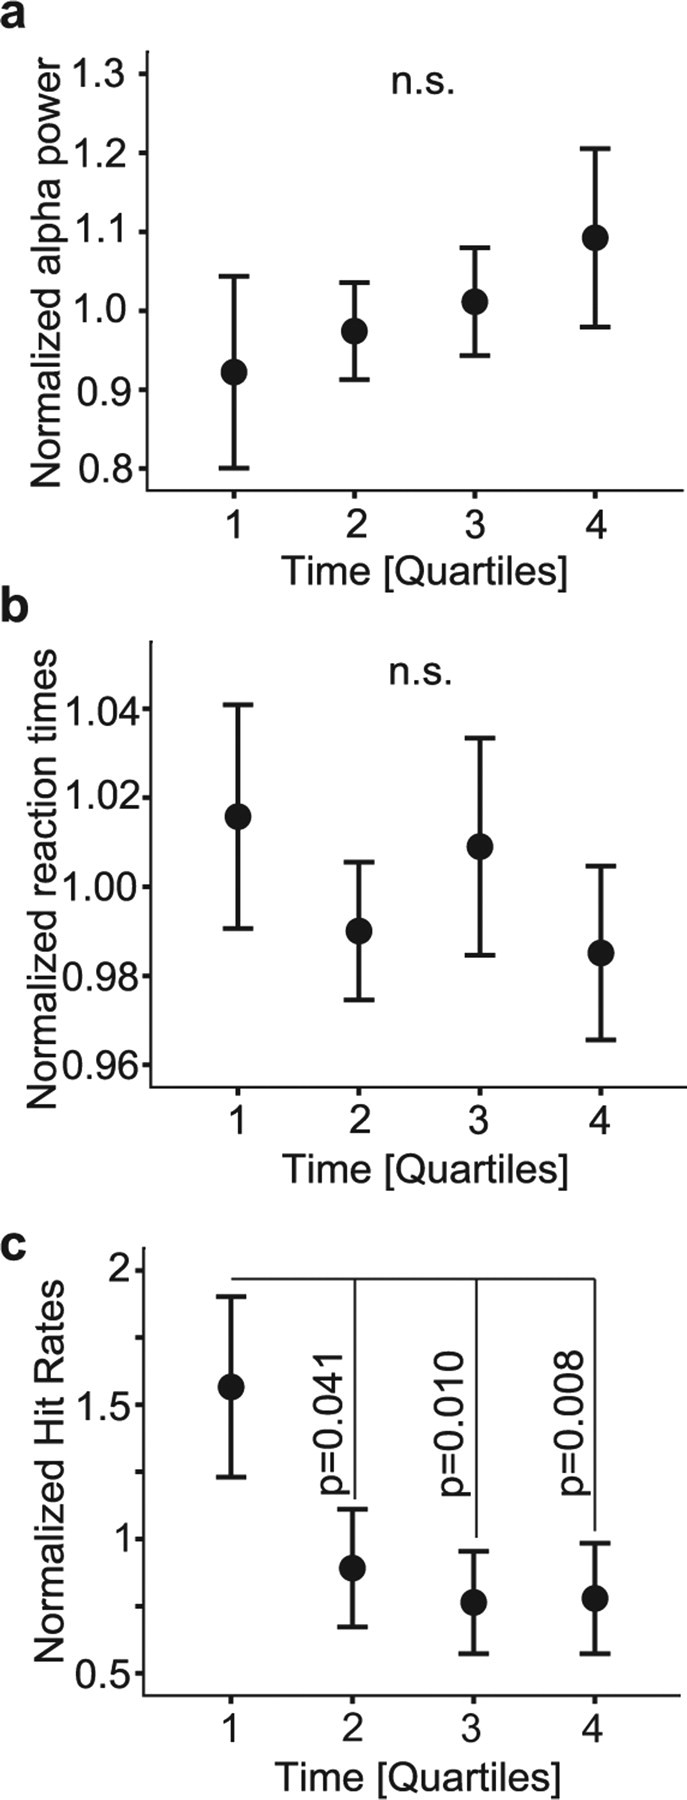
Figure 5.

Alpha power and reaction times during the experiment. a, b, The alpha power (a) and reaction times (b) did not change during the course of the experiment. c, Hit rates were significantly stronger in the first quartile compared with the rest. Error bars represent SEM.
