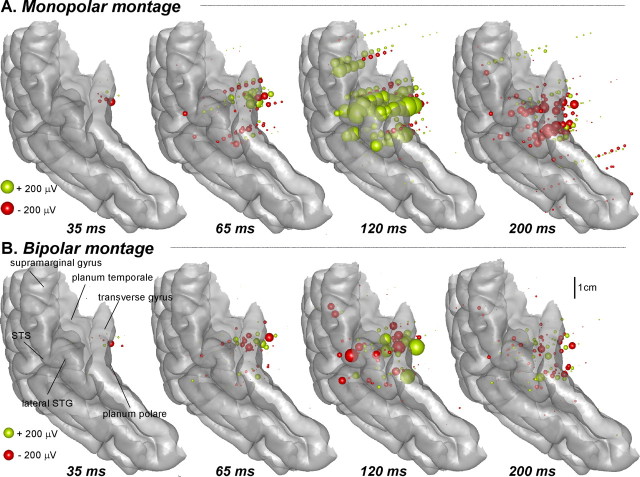
Figure 3.
Statistically significant auditory response to the auditory syllables in all patients reported on a common 3D representation of the auditory cortex at 35, 65, 120 and 200 ms after the onset of the auditory stimulus. Each sphere represents the amplitude recorded at one contact in one patient. The radius of the sphere is proportional to the response amplitude, and its color indicates the polarity. Left activations were reported on the right hemisphere. A, Monopolar montage (the voltage values are measured between each contact and a common reference contact) provides information about the polarity of the recorded component. B, Bipolar montage (voltage values are measured between two adjacent contacts); amplitudes in this case indicate that the corresponding neural sources are very close to the site of recording.

