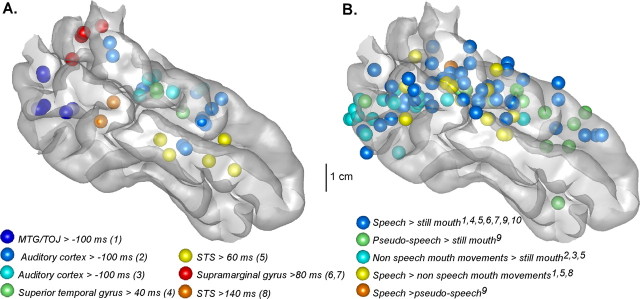
Figure 4.
Comparison between (A) intracortically recorded responses to lip movements and (B) fMRI results from lipreading experiments, displayed on a lateral view of the MNI brain temporal cortex. In both cases, spheres stand for activations regardless of the size of the effect found. Left activations were reported on the right hemisphere. A, Statistically significant activations evoked by lip movements alone in our experiment. Each color stands for a cluster of similar responses observed in at least two patients. Numbers in parentheses refer to the type of the visual response as characterized in supplemental Table 2, available at www.jneurosci.org as supplemental material, and described in the text. Individual coordinates have been converted into the MNI space using Talairach method. B, Each color corresponds to a particular contrast that has been tested in studies by the following: (1) Calvert et al. (1997); (2) Puce et al. (1998); (3) Puce and Allison (1999); (4) MacSweeney et al. (2000); (5) Campbell et al. (2001); (6) MacSweeney et al. (2001); (7) Olson et al. (2002); (8) MacSweeney et al. (2002); (9) Paulesu et al. (2003); (10) Calvert and Campbell (2003). When originally given in Talairach space, fMRI activations were converted into the MNI space using the Talairach method.

