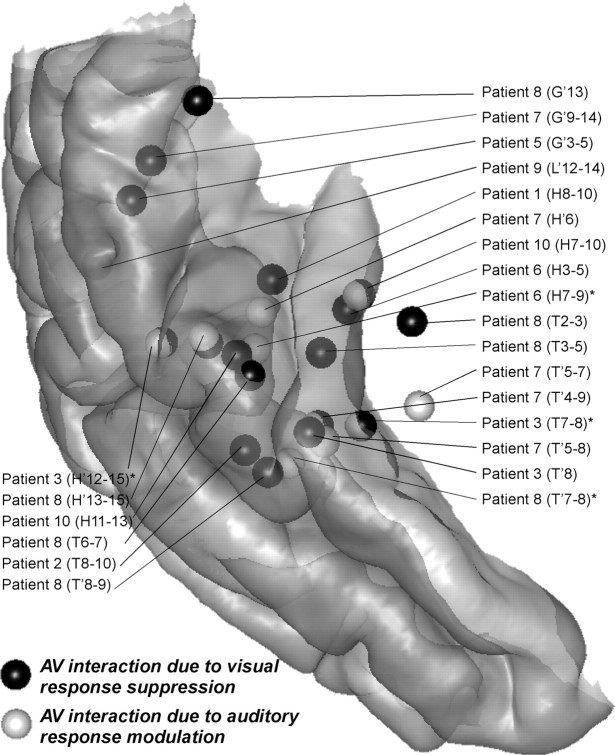
Figure 6.
Locations of the interaction responses in the superior temporal cortex. The individual coordinates have been converted to MNI coordinates using the Talairach method and reported on the standard MNI brain. Left activations were reported on the right hemisphere. (*) Indicates that the effect was significant only in the monopolar data for the second type of interaction (see Results, Audiovisual interactions).

