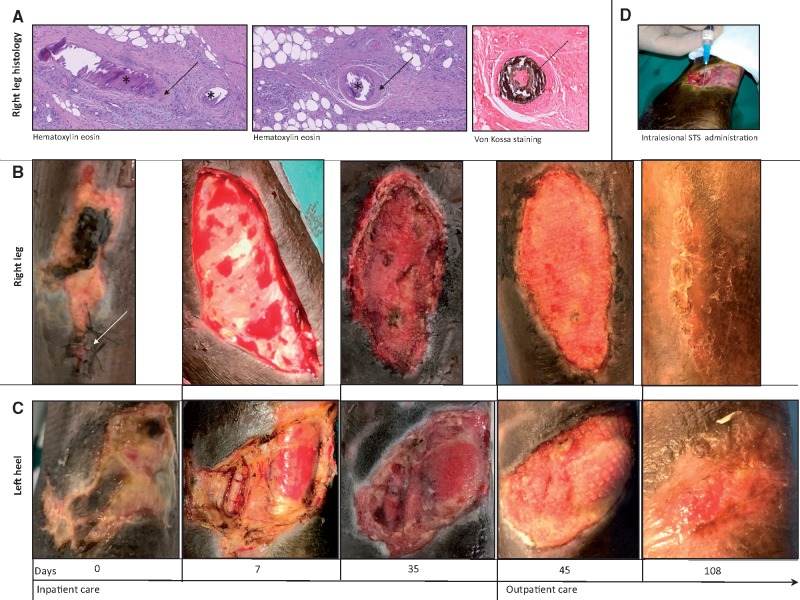
FIGURE 1.
Iconographic report. (A) Histology (haematoxylin–eosin and Von Kossa staining) of cutaneous biopsy performed at the border of right leg. Asterisks indicate basophil intraluminal calcifications; solid arrows: fibrointimal hyperplasia; dashed arrow: intraluminal calcifications typical of calciphylaxis. (B) Pictures of the right leg ulcer. Arrow: site of biopsy. (C) Pictures of the left heel ulcer. (D) Intralesional administration of STS.

