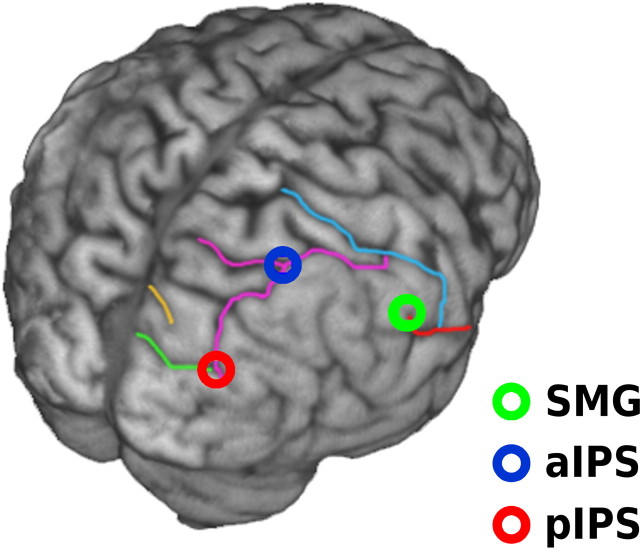
Figure 2.
Sites of cortical stimulation. In each session, TMS was applied to one of three cortical sites in the right hemisphere, shown here on the rendered cortical surface of one participant. The highlighted sulci were used to identify the sites of stimulation, including SMG (green circle), aIPS (blue circle), and pIPS (red circle). Mean MNI coordinates (x, y, z ± 1 SD) were 63 ± 2.5, −40 ± 5.1, 43 ± 5.4 for SMG, 33 ± 6.9, −61 ± 5.8, 64 ± 4.9 for aIPS, and 25 ± 5.2, −86 ± 4.1, 42 ± 8.4 for pIPS.

