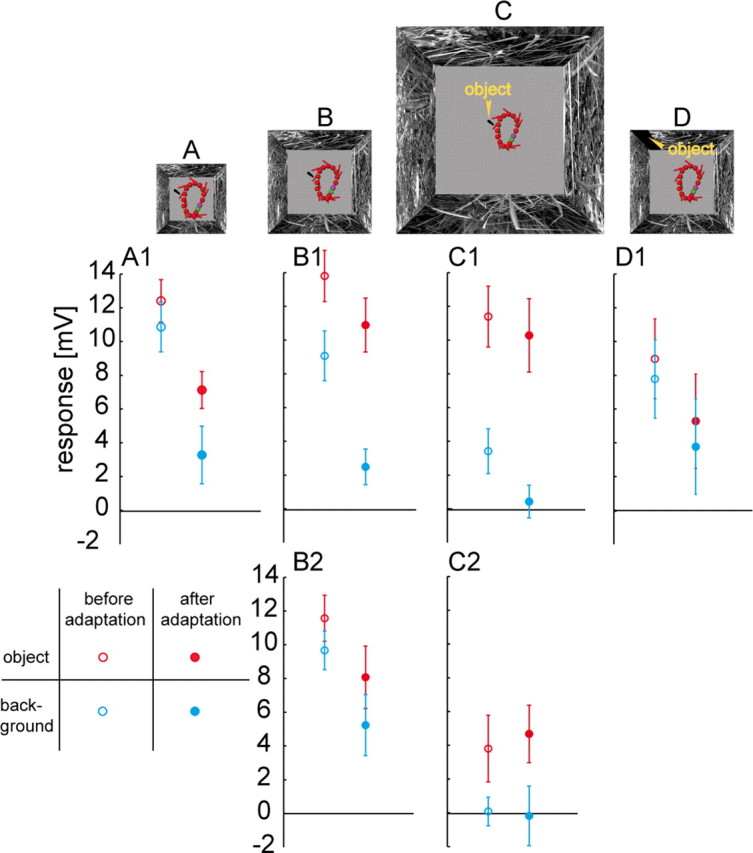
Figure 2.

Mean responses (±SD) to object and background before and after adaptation. A–D, The same flight trajectory (top view) in small, original, large, and control arena. The position of the fly's head and its orientation are shown every 45 ms (red symbols). The location of the black object is given by the yellow markers. To enhance the visibility of the black object in the plot, lighter color of the floors in all arenas are used. A1–D1, Responses within the 30 ms intervals marked in Figure 1, F and G, averaged of 5, 10, and 10 left HS-cells and 4 left HSE-cells, respectively. Data before and after motion adaptation are gathered during the first and the eighth loop. B2, C2, Mean responses of 5 right HS-cells, calculated in a 30 ms time interval. The time interval corresponds to the presence of the object in the receptive field of the right HS-cells in the “object” condition.
