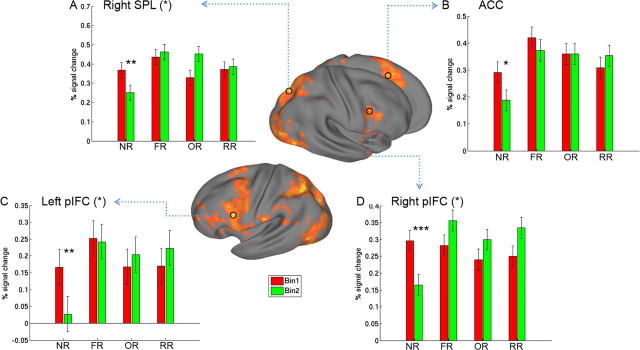
Figure 4.
A–D, The ACC-pIFC-parietal network showed significant decreases for NR from Bin1 to Bin2 but remained stable for all reversal learning conditions. Surface rendering for the lateral view (middle) was created by mapping the overall reversal learning effect (all reversal conditions vs NR) into a population-averaged surface atlas. The small circles mark the location of the functionally defined regions of interest (ROIs). Percentage signal change is plotted for each condition and each bin in these ROIs (see Materials and Methods). Asterisks in parentheses indicate the significant effect of the bin-by-condition interaction. Asterisks near the bar indicate significant difference between Bin1 and Bin2 for that condition. Error bars represent the within-subject error. *p < 0.05, **p < 0.01, ***p < 0.001.

