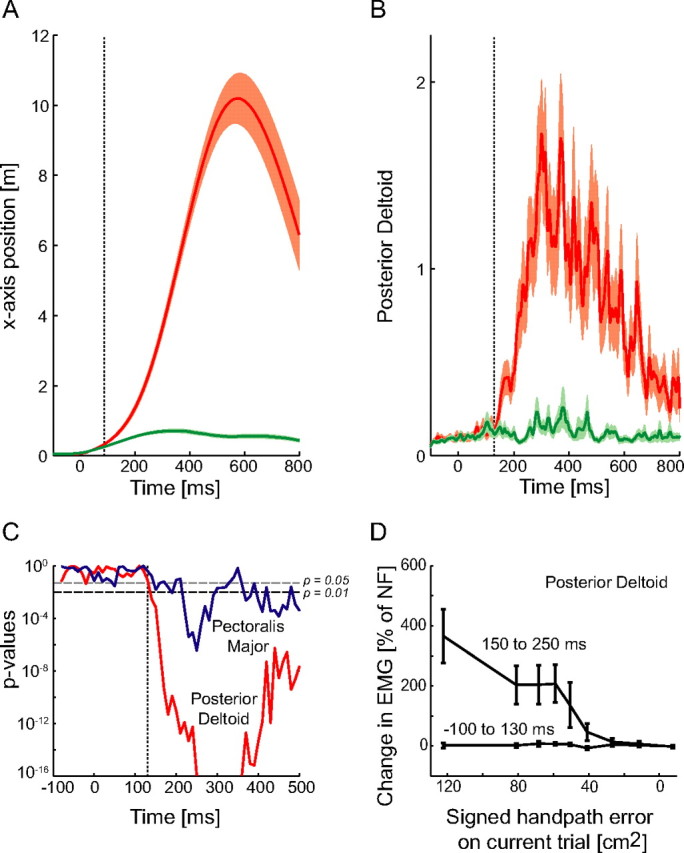
Figure 3.

Onset of feedback during perturbed trials. A, Position (x-axis) in the BE trials (red) compared with that in the NF trials (green) as a function of the time. Shaded regions represent the SEM of the position. The dotted line indicates the time at which the position in the BE trials was significantly (p < 0.05) different from that in the NF trial. Data is shown for one subject. B, Posterior deltoid muscle activity in the BE trials (red) compared with that in the NF trials (green). C, Muscle activity in BE trials was compared with that in NF movements. The p values of these comparisons are plotted on a log scale against time interval to determine the onset of the feedback response. No significant differences were seen before 130 ms (dotted vertical line) after movement onset. The horizontal line is located at p = 0.01. The earliest feedback responses occurred in the posterior deltoid muscle (shown). D, Responses in the posterior deltoid for two different time intervals (−100 to 130 ms) and (150–250 ms) relative to the onset of the movement. For each interval the integrated muscle activity was determined and grouped according to the signed handpath error. The mean values ± SEM are shown as a percentage increase in the muscle activity relative to the muscle activity in the NF movements for the same time interval. An ANOVA was used to compare differences with a main effect of signed handpath error and random effect of subjects. As expected, there was no significant difference in the muscle activity in the early interval (p = 0.28), i.e., before 130 ms after the onset of movement, whereas a clear response is seen in the later interval (p < 0.00001).
