FIGURE 4.

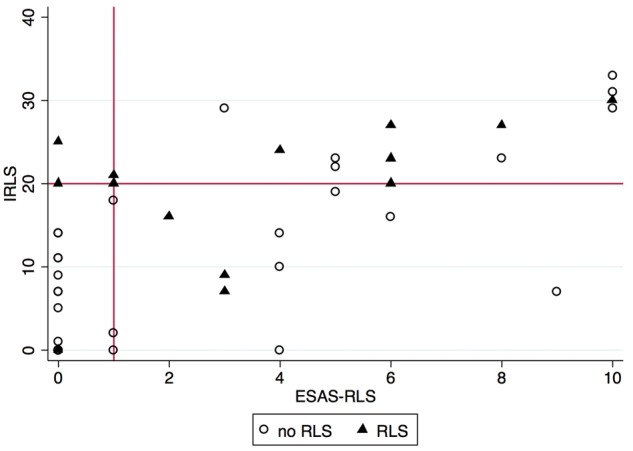
Scatterplot of ESAS-RLS and IRLS. r = 0.70, P = 0.0000. IRLS cutoff of ≥20 is labeled on the y-axis and ESAS-RLS cutoff of ≥1 is labeled on the x-axis.

Scatterplot of ESAS-RLS and IRLS. r = 0.70, P = 0.0000. IRLS cutoff of ≥20 is labeled on the y-axis and ESAS-RLS cutoff of ≥1 is labeled on the x-axis.