
FIGURE 3.
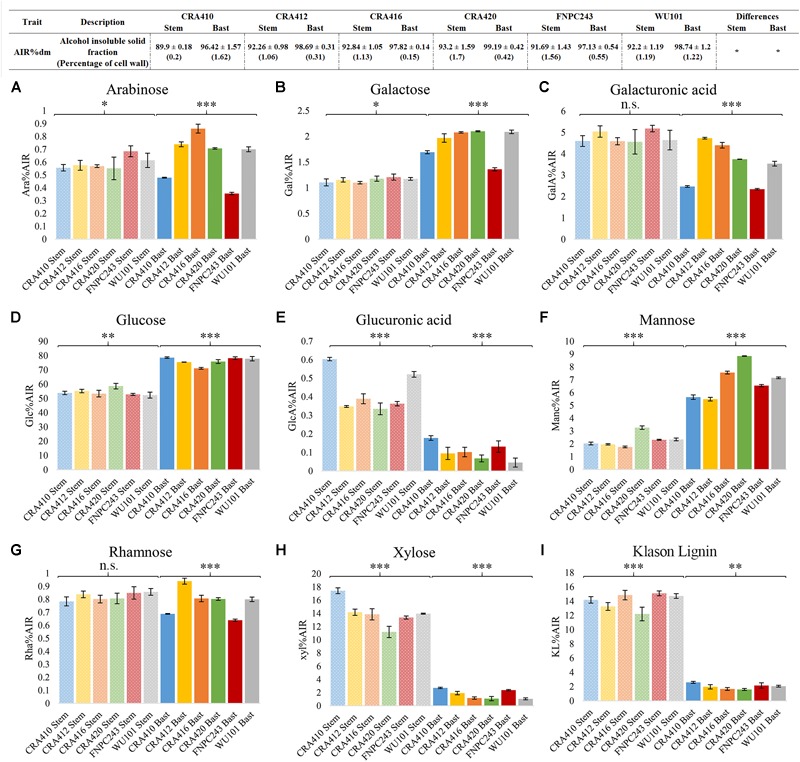
Cell wall composition of the bast fiber and the entire stem of six hemp contrasting accessions. Table: The values correspond to the mean ± standard deviation. Percentages of coefficient of variation (CV%) between technical replicates are shown between brackets. Figure: The columns represent the means and the bar of each column represents the standard deviation. The contents of the nine cell wall components [arabinose (A), galactose (B), galacturonic acid (C), glucose (D), glucuronic acid (E), mannose (F), rhamnose (G), xylose (H), and Klason lignin (I)] were significantly different (p < 0.001) between the bast and the stem. ∗p < 0.1, ∗∗p < 0.01, ∗∗∗p < 0.001, and n.s., no-significant.