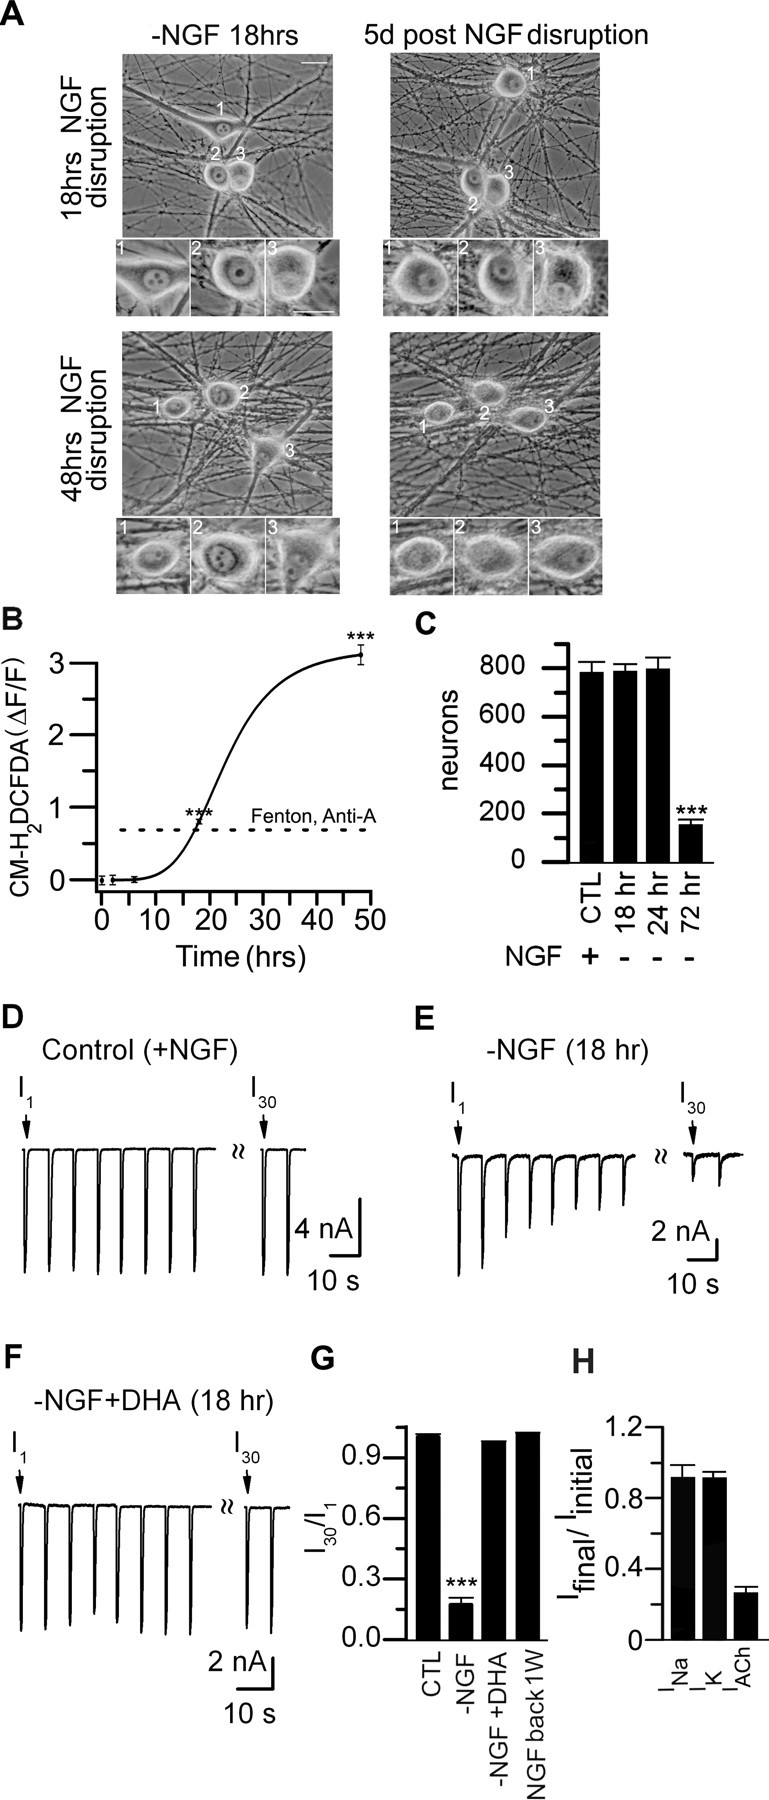
Figure 7.

Transient interruption in nerve growth factor signaling increases cytosolic ROS and causes rundown of ACh evoked currents. A, Phase micrographs of sympathetic neurons in culture for 2 weeks. NGF was removed for 18 h (top) or 48 h (bottom). The micrographs were taken at 18 h after removing NGF (left) and the same field retaken 5 d (right) after replacing NGF. The insets are magnified images of the cell bodies in each field. After 18 h without NGF followed by 5 d with NGF, the neurons have phase-bright nuclei, clearly visible nucleoli; however, after 48 h without NGF, the neurons are in poorer health. B, ΔF/F measurements from sympathetic neurons before and after being deprived of NGF for 2, 6, 18, and 48 h (>50 neurons were measured at each time point). Neurons were loaded with CM-H2DCFDA for 1 h and then imaged. The fluorescence remained near basal levels for the first 6 h; after 18 h of NGF removal, the increase in ΔF/F was comparable with that induced by ROS from the Fenton reaction or antimycin-A (dotted line). The solid line is a Hill function. C, Number of neurons per culture before (CTL) (n = 80) and 5 d after a transient removal of NGF for 18 h (n = 150), 24 h (n = 53), or 48–72 h (n = 109). A transient interruption in NGF signaling for 18 h had no significant effect on neuronal survival. D–F, ACh-evoked currents in response to a series of 1 s ACh (100 μm) applications delivered at 15 s intervals from a control (+NGF) neonatal mouse SCG neuron (D) in culture for 10 d, one in a sister culture deprived of NGF for 18 h (E), and one in a sister culture deprived of NGF for 18 h but pretreated with antioxidants (DHA) for 24 h at 6 h before NGF removal (F). G, I30/I1 ratio for neurons from control (CTL) (n = 7), 18 h after NGF removal (−NGF) (n = 14), 18 h after NGF removal with antioxidants (−NGF + DHA) (n = 6), and 1 week after a transient 18 h NGF withdrawal (n = 6). The SEs are too small to resolve. H, Bar graph showing the ratio of the peak INa and IK (mean ± SE; n = 7) before and after rundown of the ACh-evoked currents on neurons 18 h after removal of NGF. There was no significant difference in the peak INa or IK before and after rundown of the ACh-evoked currents. ***p < 0.001.
