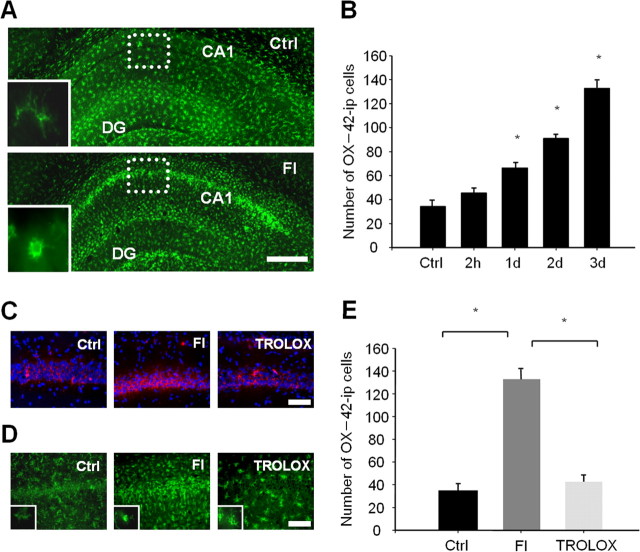
Figure 1.
Free radicals are required for microglial activation in the CA1 region after TFI. A, Fluorescent photomicrographs of the hippocampal section immunolabeled with the OX-42 antibody 3 d after sham operation (top) or TFI (bottom). Resting and activated microglia in the CA1 area are presented in the inlet. Scale bar, 500 μm. B, Quantitative analysis of OX-42-immunopositive (ip) microglial cells in the square (dotted lines) underlying the CA1 area at the indicated time points after forebrain ischemia. Data are presented as means ± SEM (n = 4 for each condition). *Significantly different from the sham control at p < 0.05 with ANOVA and Student–Newman–Keuls analyses. C, D, Fluorescent photomicrographs of the hippocampal CA1 area labeled with MT Red CM-H2XROs (red) and Hoechst 33258 (blue) at 2 h (C), immunolabeled with OX-42 antibody at 3 d (D) after sham operation (left), forebrain ischemia alone (middle), or in the presence of trolox (right; 50 mg/kg, i.p.) immediately after reperfusion. Scale bars, 200 μm. E, Quantitative analysis of OX-42-ip microglial cells in the square (dotted lines) underlying the CA1 area at 3 d after the sham operation (Ctrl) or forebrain ischemia alone or in the presence of trolox immediately after reperfusion. Data are presented as means ± SEM (n = 4 animals for each condition). *Significantly different from the relevant control at p < 0.05, using ANOVA and Student–Newman–Keuls analyses.

