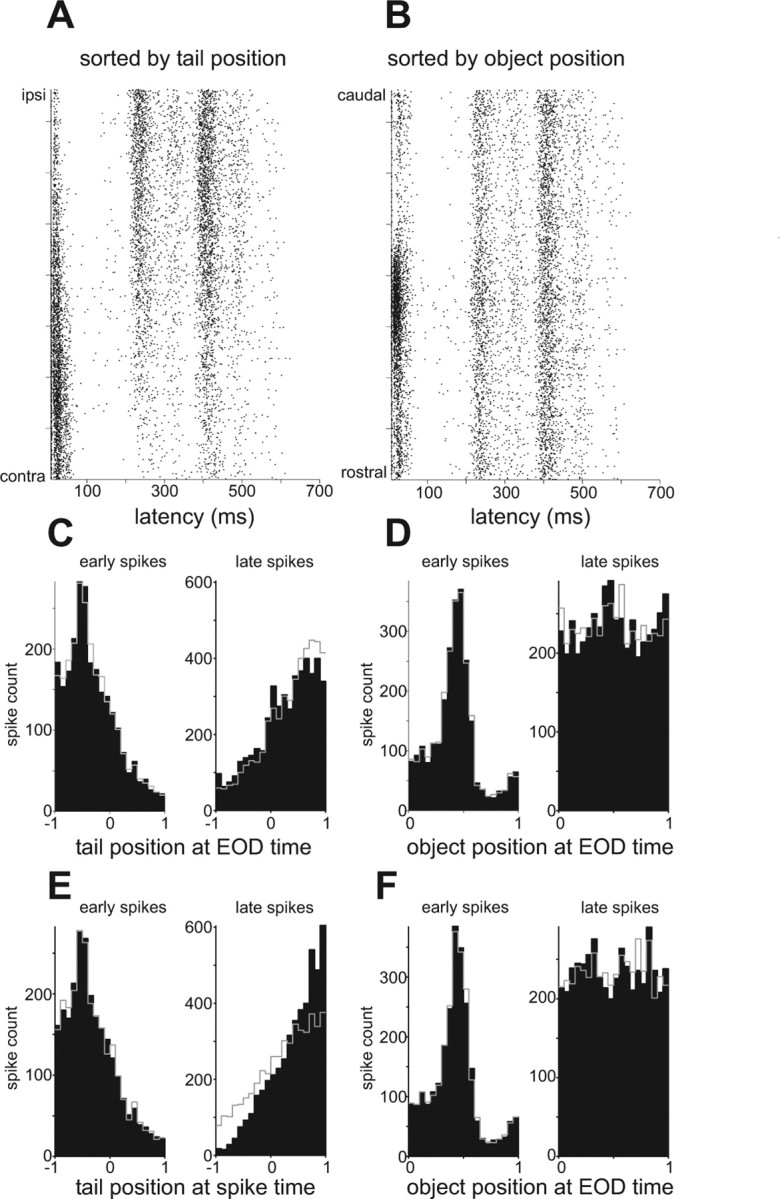
Figure 9.

Dependence of late spikes on tail position in a representative I-cell. A, B, Rasters sorted by tail (A) and object (B) position for a representative I-cell. Note the opposite dependence of early and late spikes on tail position in A. C, D, Spike count histograms illustrating the dependence of early (0–100 ms; left) and late (>400 ms; right) spikes on the position of the tail (C) and on the position of the object (D) at the time of the preceding EOD. Tail position: −1 = contralateral; 1 = ipsilateral. E, F, Same data as in C and D, but plotted with respect to the position of the tail/object at the time of the spike. Note that late spikes exhibit a stronger dependence on tail position at the spike time than at the EOD time (compare right panels in C and E). See Results for explanation of predicted histograms plotted in gray in C–F.
