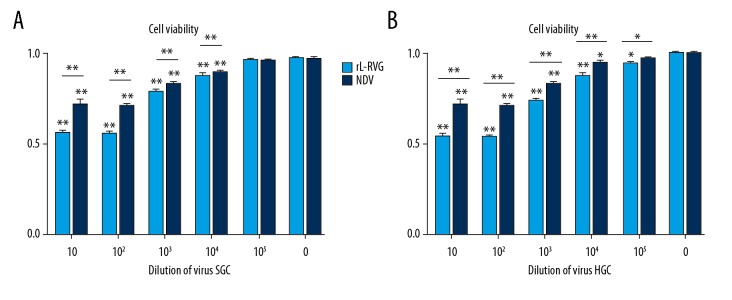
Figure 2.
Proliferation changes of gastric cancer cells after infecting with rL-RVG or NDV were monitored by MTT analysis. (A) Dose-response curve of SGC cells after infection with rL-RVG or NDV for 24 h. The cells infected with rL-RVG for 103 dilution showed significantly decreasing absorbance when compared with the NDV group (* p<0.05). (B) Dose-response curve of HGC cells after infecting with rL-RVG or NDV for 24 h. The cells infected with rL-RVG for 103 dilution showed significantly decreased absorbance when compared with cell viability of the NDV group (** p<0.01).

