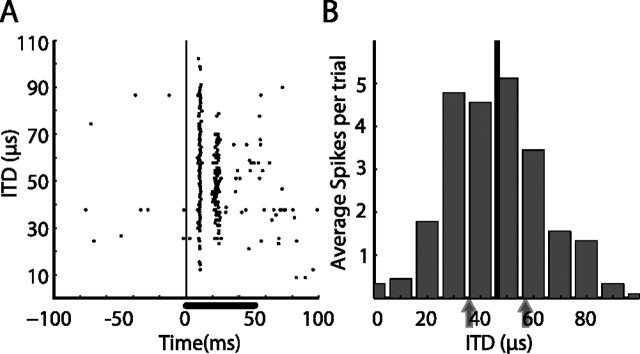
Figure 1.
Example of an ITD tuning curve. A, Raster plot showing responses of a tectal unit to sounds with different ITD values. Stimulus duration was 50 ms (horizontal bar) starting at time 0 (vertical line). B, The average response per trial as a function of the ITD value. The best ITD value is designated by the black vertical line. Two ITD values of equal distances (±10 μs) from the best ITD (gray arrows) were selected to test for SSA in this neuron.

