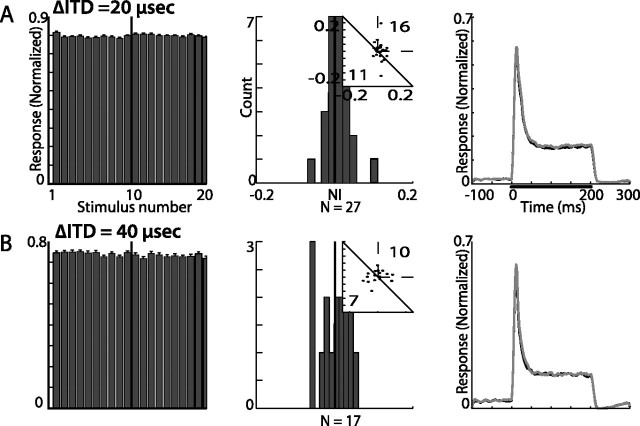
Figure 12.
Summary of results from ITD constant order tests in the ICX. A, Results from tests with ITD gaps of 20 μs. B, Results from tests with ITD gaps of 40 μs. Histograms in the left column show the population response (normalized and averaged across all recording sites) to the constant order sequence of 20 stimuli. The first 10 bars present responses to the stimuli with ITD values left of the best ITD and the last 10 bars present responses to ITD values right of the best ITD. Error bars indicate SEs. The NI distribution and the SIs scatterplots (insets) are shown in the middle column. The number of points above and below the diagonal line are shown in the top right and bottom left corners of the scatterplots, respectively. Right column shows the population PSTHs, normalized and averaged. Gray lines designate the population response to the rare stimulus and black lines designate the population response to the common stimulus. The bar in the top plot represents the duration of stimulation.

